Table of Contents
ARC Performance Reports
Pre-aggregated daily reports providing insights into event handling, operator performance, and camera activity for Alarm Receiving Centres (ARCs) and monitoring stations.
Overview
ARC Performance Reports are generated automatically each night for all active timelines. They provide:
- Event volume tracking - Total events, hourly distribution, and trends over time
- Response time metrics - Average, median, and distribution of operator response times
- Operator performance - Events handled and response times per operator
- Camera activity - Busiest cameras and average events per camera
- Outcome tracking - Soft-closed, hard-closed, and open event counts
Reports are accessed via Settings > ARC Performance Report.
Trends Page
The trends page displays aggregated data across the last 60 days:
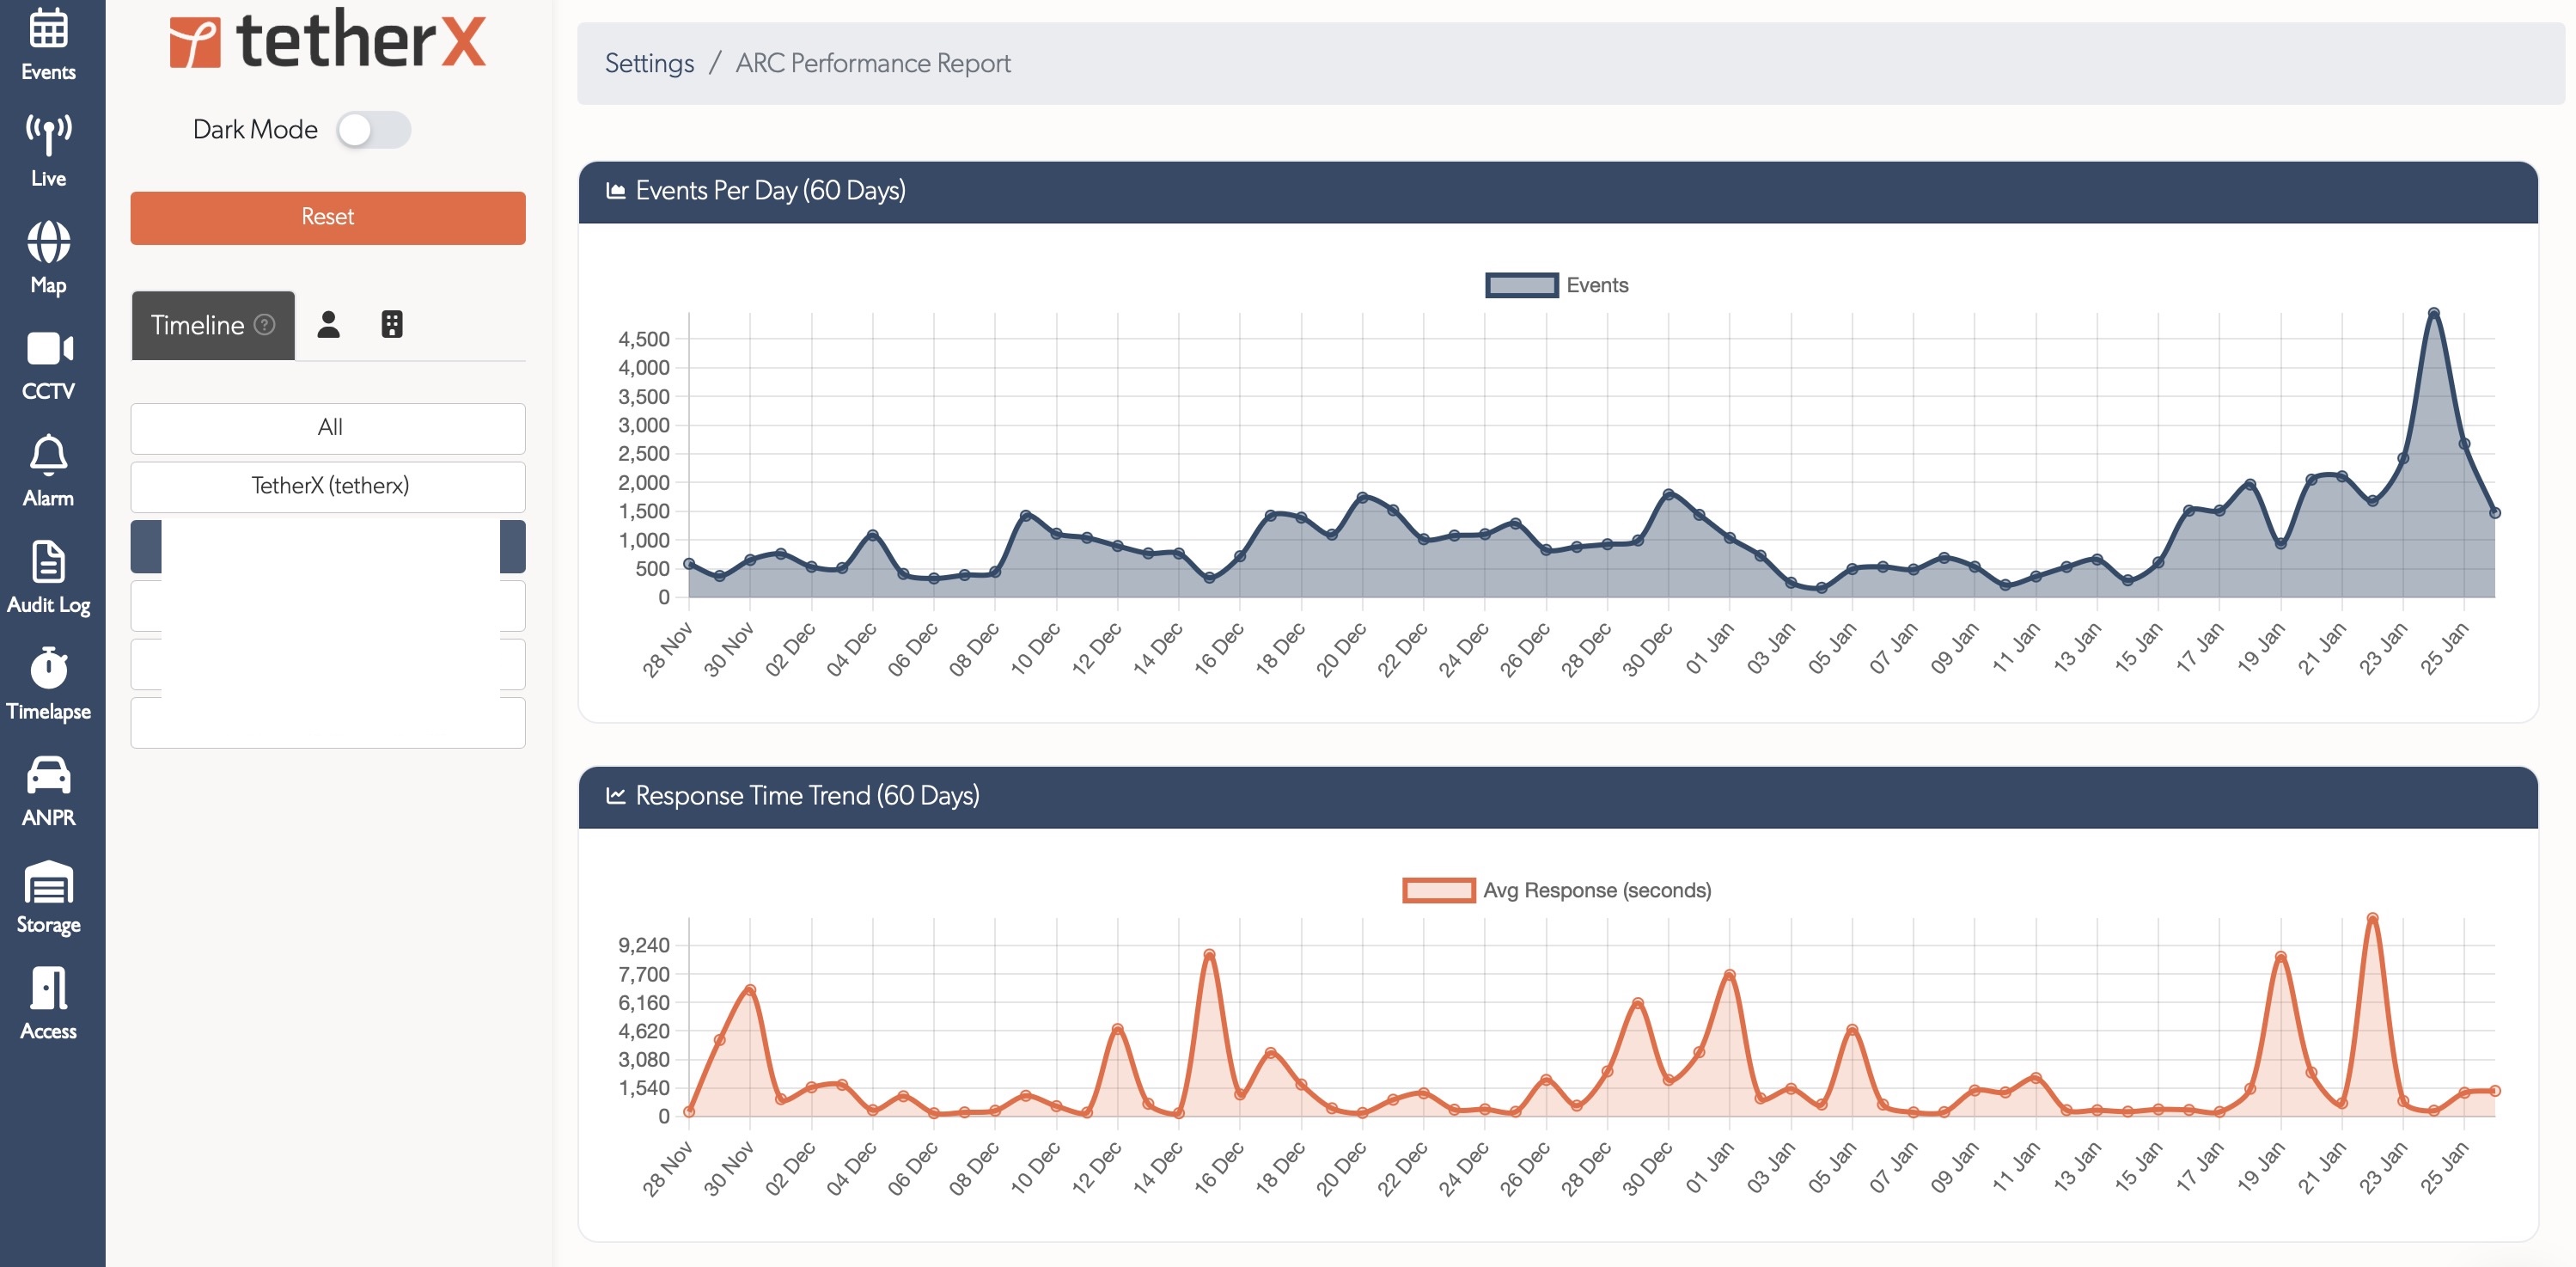
Events Per Day Chart
Line chart showing daily event volume trends. Useful for identifying:
- Seasonal patterns
- Unusual spikes requiring investigation
- Long-term volume changes
Response Time Trend
Line chart showing average response times over 60 days. Helps track:
- Operator efficiency trends
- Impact of staffing changes
- SLA compliance over time
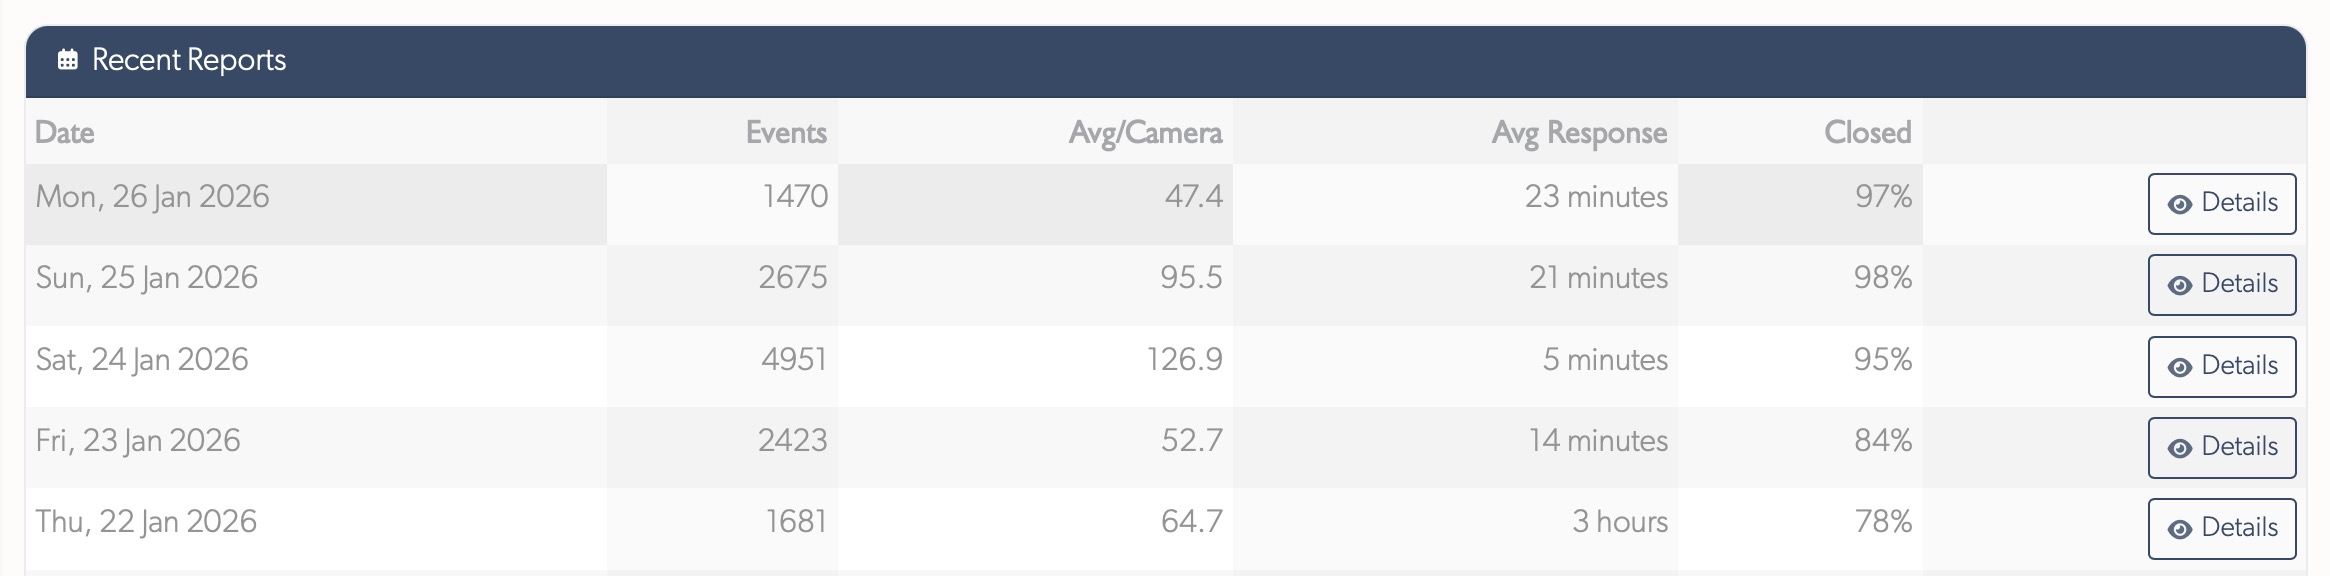
Recent Reports Table
Paginated table showing daily reports with key metrics:
| Column | Description |
|---|---|
| Date | Report date |
| Events | Total events for the day |
| Avg/Camera | Average events per camera with activity |
| Avg Response | Average time to soft-close events |
| Closed | Percentage of events closed |
| Details | Link to day detail page |
Day Details Page
Click "Details" on any report to view detailed metrics for that day.
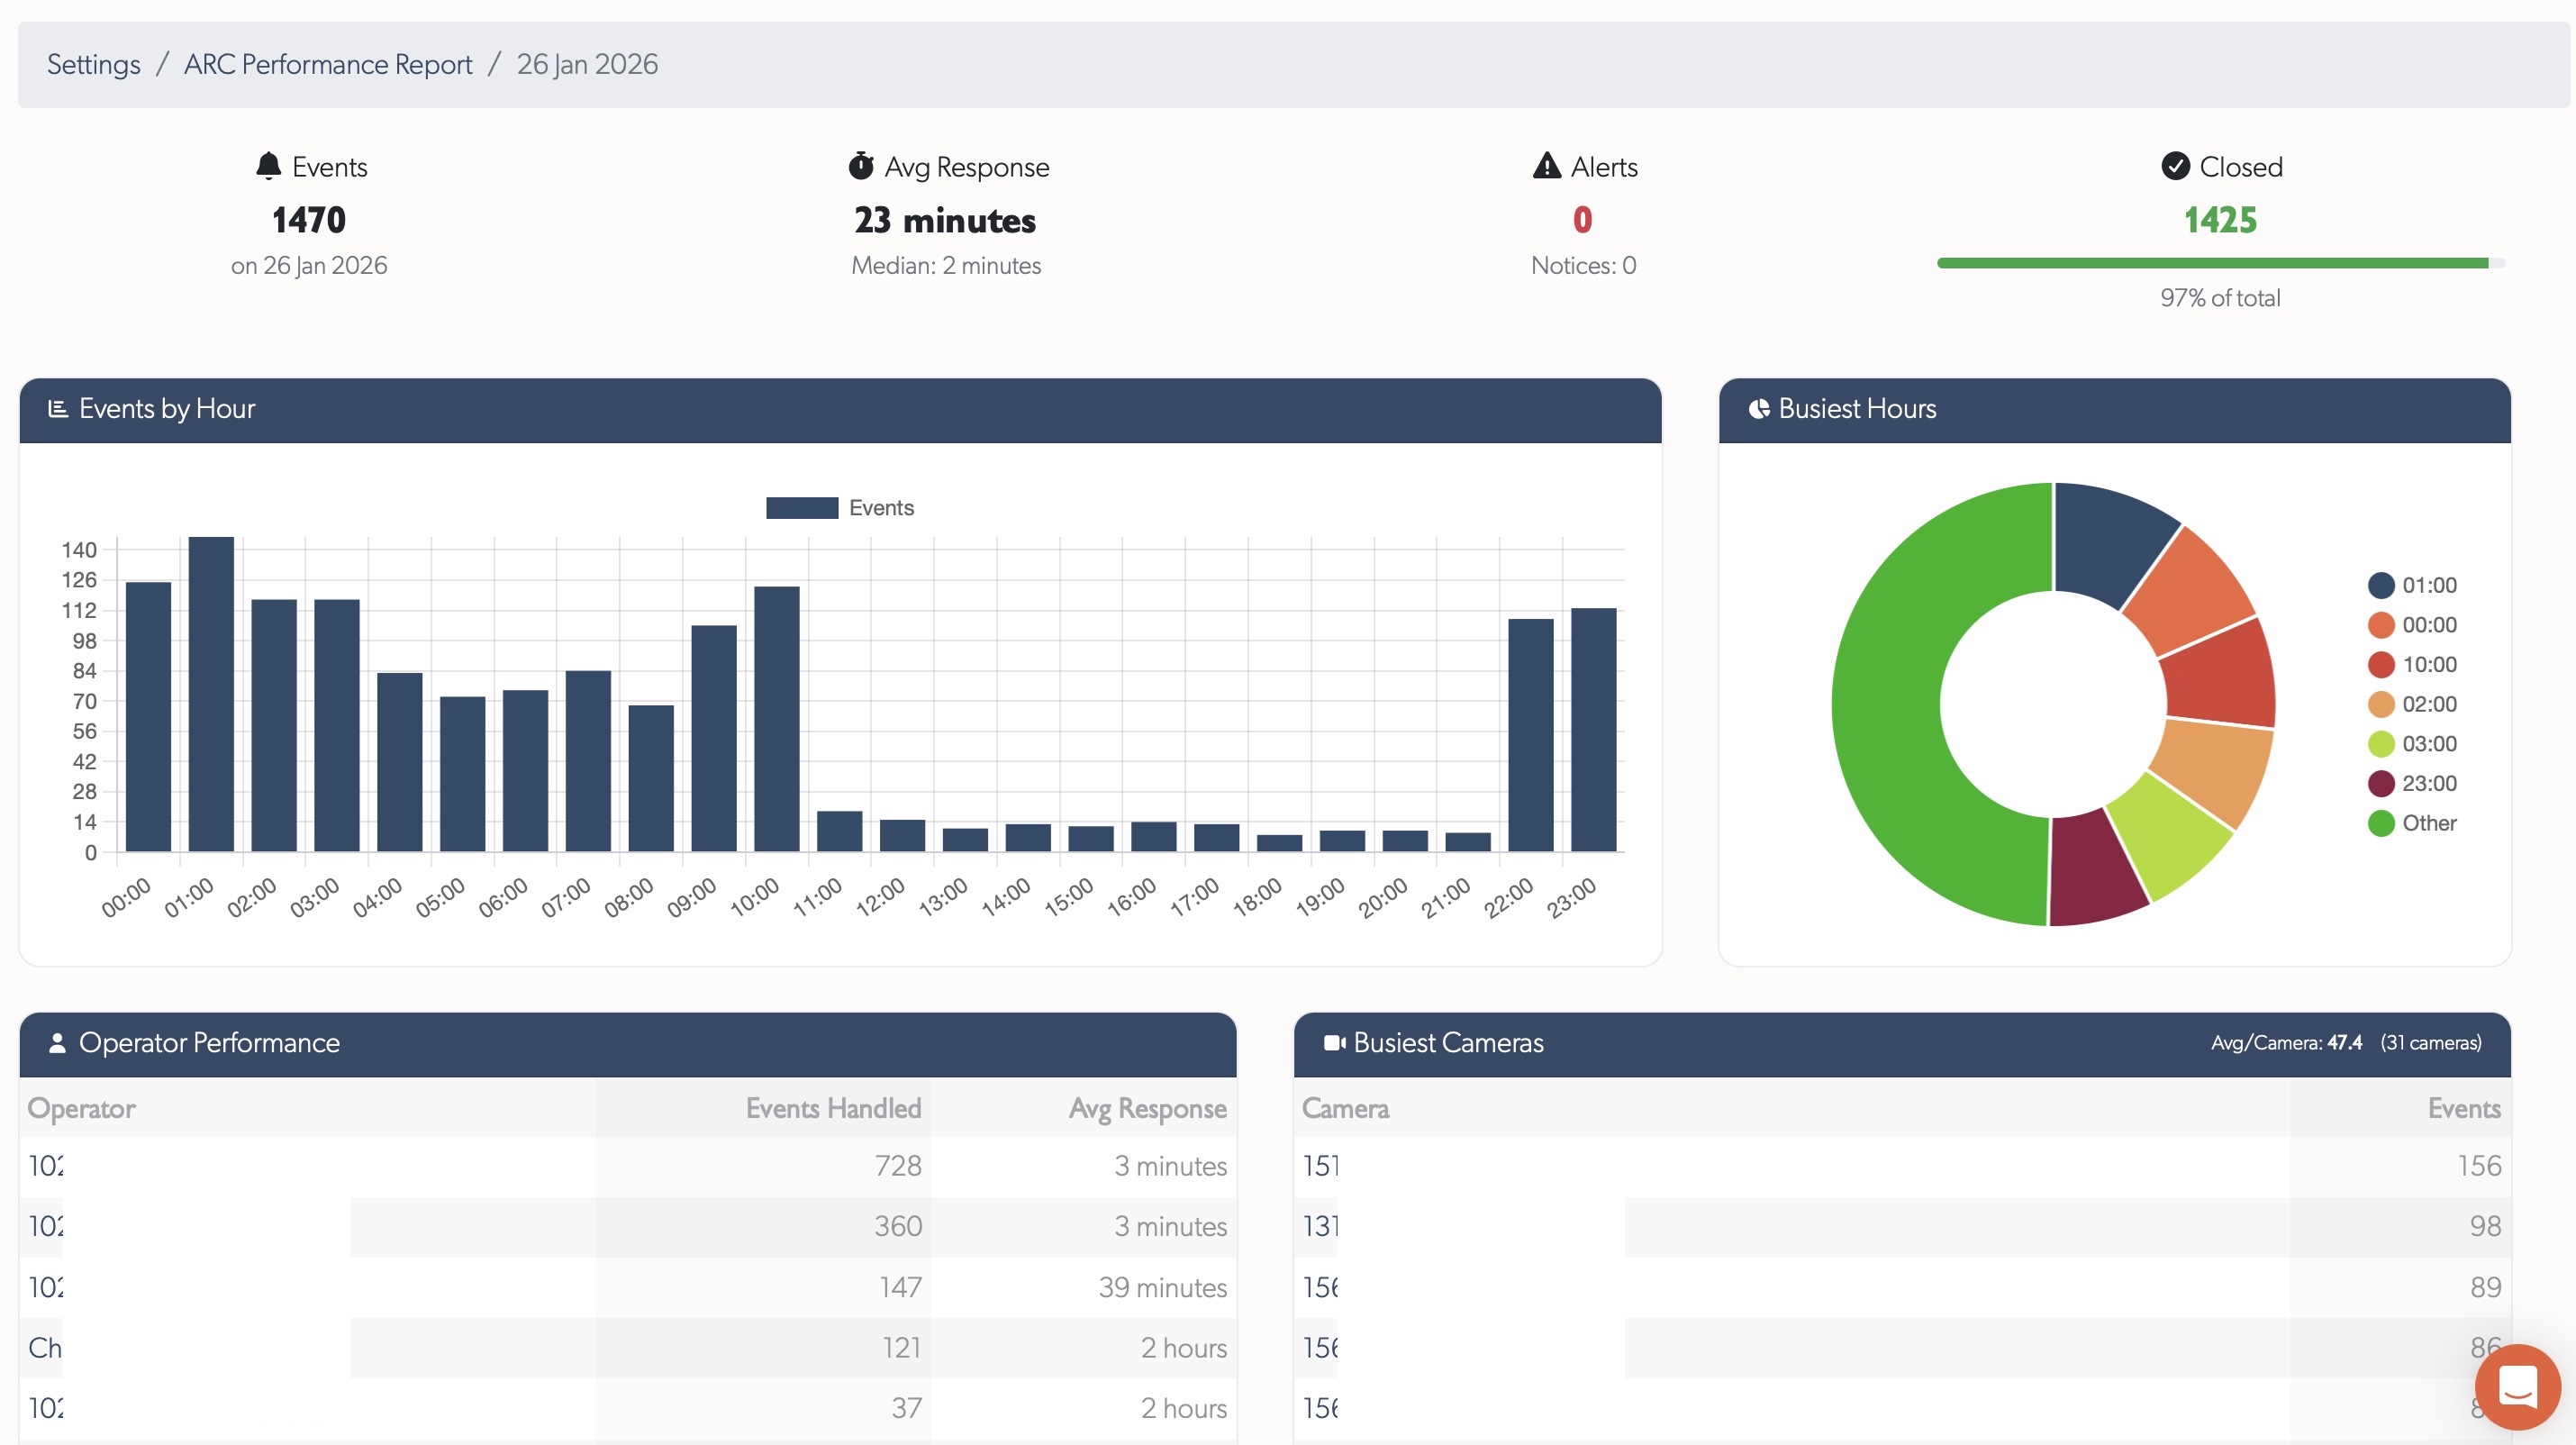
KPI Cards
Four summary cards at the top:
- Events Total - Total events received
- Avg Response - Average soft-close time with median
- Alerts - Alert-severity events (with notice count)
- Closed - Events closed with percentage progress bar
Events by Hour
Bar chart showing event distribution across 24 hours. Identifies:
- Peak activity periods for staffing decisions
- Quiet periods for training or maintenance
- Unusual hourly patterns
Busiest Hours
Pie chart showing the top 6 hours by event volume, with remaining hours grouped as "Other".
Operator Performance Table
Table showing each operator's activity for the day:
| Column | Description |
|---|---|
| Operator | Name (linked to user profile) |
| Events Handled | Number of events soft-closed |
| Avg Response | Average response time for this operator |
Sorted by events handled descending.
Busiest Cameras Table
Table showing cameras with the most events:
| Column | Description |
|---|---|
| Camera | Zone name (linked to zone page) |
| Events | Event count for this camera |
Header shows average events per camera across all cameras with activity.
Response Time Distribution
Breakdown of response times into buckets showing how quickly operators respond:
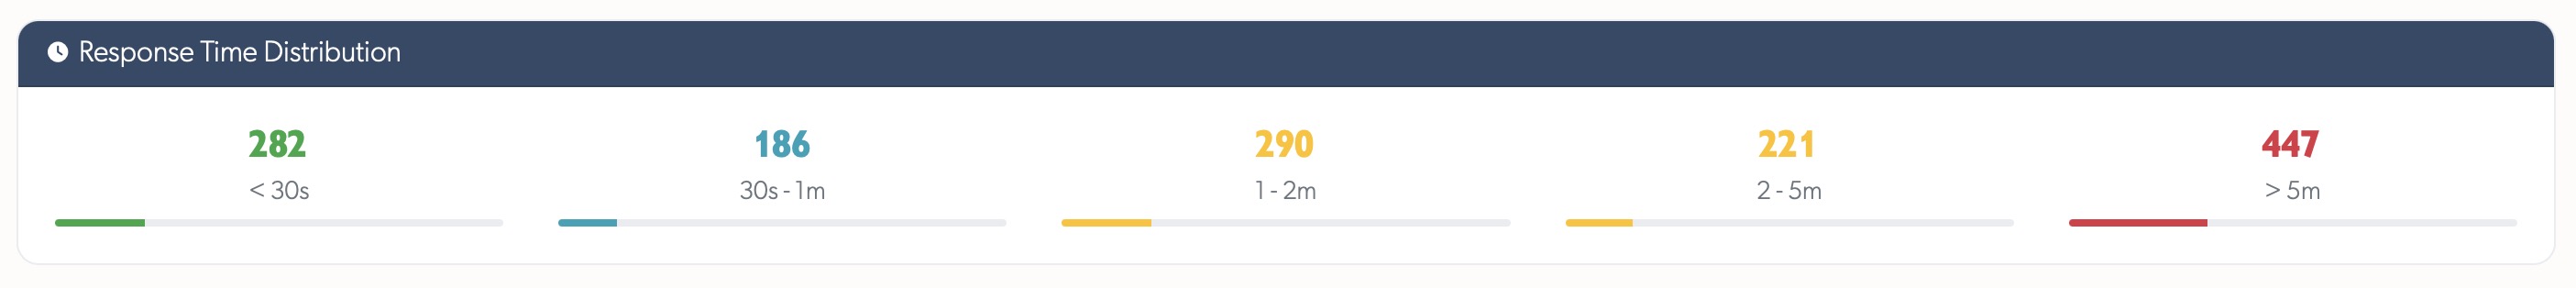
- < 30s (green) - Fastest responses
- 30s - 1m (blue) - Quick responses
- 1 - 2m (yellow) - Moderate responses
- 2 - 5m (orange) - Slower responses
- > 5m (red) - Responses requiring attention
Progress bars show relative proportions for visual comparison.
Timeline Selection
Use the timeline selector in the left sidebar to view reports for different timelines. Reports are generated separately for each timeline.
Access Control
ARC Performance Reports are available to:
- Staff users
- Integrators (for their assigned timelines)
- Admin users (for their assigned timelines)
Regular users do not have access to these reports.
Related
- Monitoring Station Operator Guide - Event processing workflows for ARCs
- Health Report - System health monitoring and alerts
Referenced in: