Table of Contents
Monitoring Station Operator Guide
This guide covers the essential workflows and features for Alarm Receiving Centre (ARC) and remote monitoring station operators processing events in TetherX.
Tip: For the control-room features behind this workflow - operator and supervisor roles, the monitoring strip, daily performance reports and how TetherX runs ARC and GSOC operations - see Control Rooms. New to the roles? Start with User Types.
Getting Started
Choosing your View
TetherX offers two view modes for processing events:
- List View - Displays events in a compact table format with timestamps, site names, camera names, and event details. Recommended for monitoring operators as it allows sequential processing and shows more events on screen.
- Thumbnail View - Displays events as image thumbnails in a grid. Useful for visual scanning but less efficient for high-volume processing.
Most operators prefer List View for systematic event processing. Switch between views using the icons in the view menu.
Processing Events
Event States
Understanding event states helps you track your workflow:
| State | Description |
|---|---|
| Open | New events requiring attention |
| Pending | Events currently being viewed by an operator - prevents multiple operators reviewing the same event. Clears after 3 minutes of inactivity |
| Closed | Events that have been reviewed and closed by an operator |
| Hidden | Events still recording in the background, but not shown in the open events list or monitoring strip |
When you open an event to review it, the system automatically marks it as Pending for 3 minutes. This prevents other operators from duplicating your work and indicates you're actively reviewing it.
Sorting Events
Tip: Select today's date in the left sidebar date picker to sort events ascending from oldest to newest. This helps process events in chronological order, ensuring older events don't get missed.
Bulk Selection and Bulk Editing
You can select multiple events at once to perform bulk actions such as closing, opening, flagging, or hiding several events simultaneously.
Drag to select: Click and drag a selection box across multiple events to select them all at once. This works in both List View and Thumbnail View.
Other selection methods:
- Use the Select dropdown in the view menu to bulk select events by time period (e.g., last hour, today)
- In List View, use the checkbox in the header row to select all events currently visible on screen
Tip: Press Escape to quickly deselect all selected events.
Once events are selected, use the bulk action buttons to close, hide, or perform other actions on all selected events at once.
Allow Bulk Event Actions (Per-Operator Permission)
Bulk actions on more than 15 events - including closing, opening, flagging, and selecting all events within time periods or filters - are gated by the Allow Bulk Event Actions permission, set individually per operator.
- Enabled by default for admin, integrator, and staff accounts
- Disabled by default for standard user accounts - an administrator must turn it on
- Find the toggle under the operator's user permissions, in the CCTV section
Warning: If you cannot bulk-select more than 15 events, ask your administrator to enable Allow Bulk Event Actions on your account. This is a deliberate safeguard - it prevents inexperienced operators from accidentally closing large batches of events.
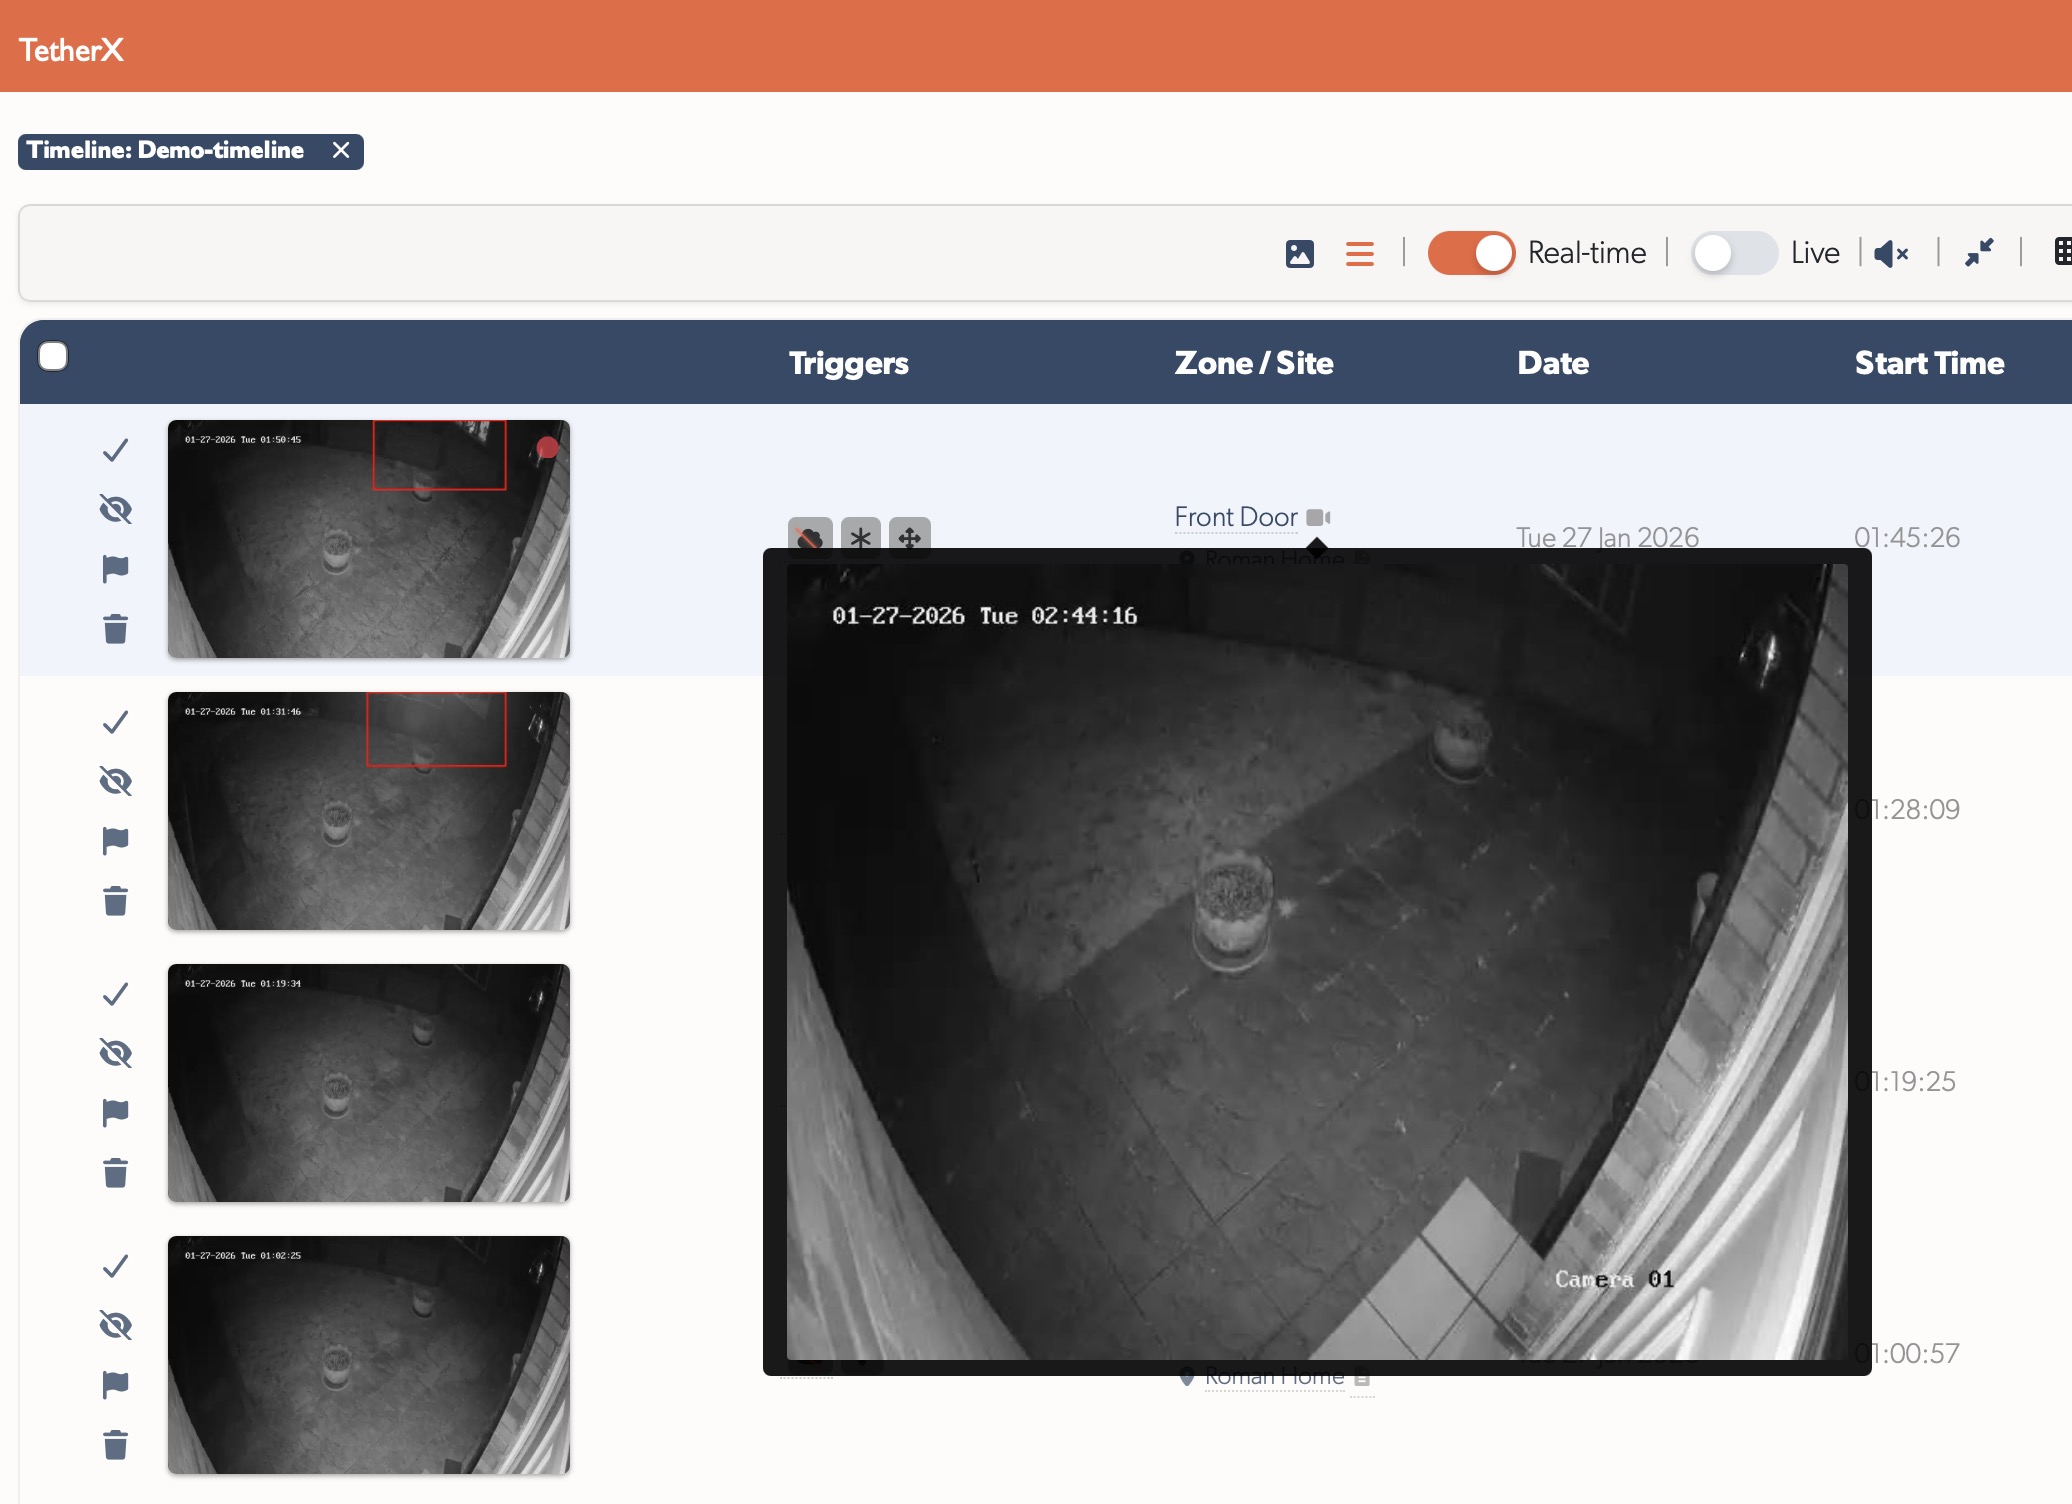
Reviewing an Event: The Operator Console
Clicking an event opens the Operator Console - a single screen built for processing one event end to end. The recording player sits in the centre, with everything you need to assess, act, and close the event around it.
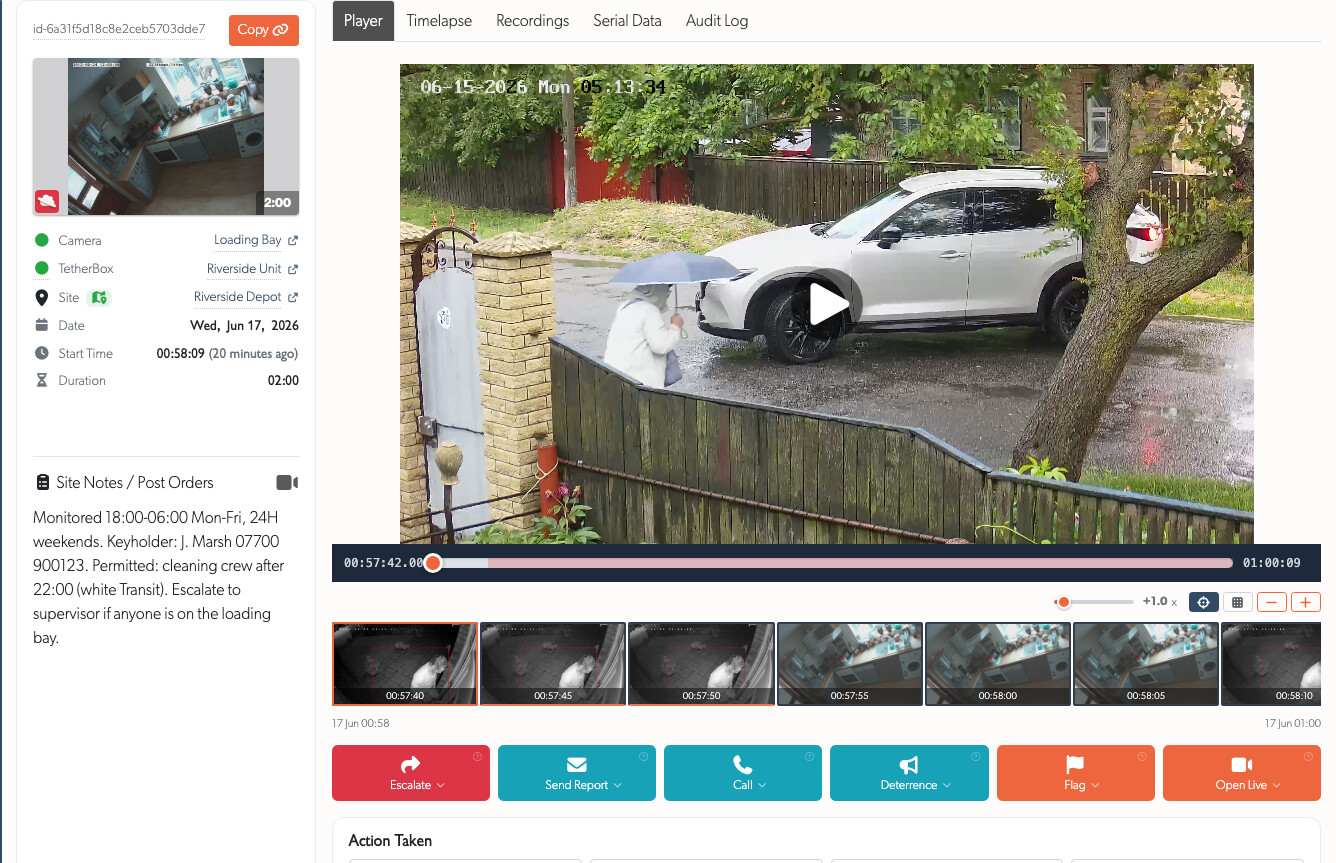
Left Panel: Event Detail
- Event ID with a Copy button to copy a direct link to the event for reports or handover
- Camera and Site names, each linking to its full record in a new tab
- Date, Start Time, and Duration
- View on Map opens the site location in Google Maps; the pin shows an inline map popover
- Hover the camera chip for a live preview of that camera right now
Site Notes / Post Orders
The left panel ends with Site Notes / Post Orders - the standing instructions for the site: access details, permitted vehicles and people, keyholder contacts, and the escalation steps to follow. Operator accounts can read these by default.
The Action Toolbar
Above the player controls, a row of action buttons handles every response you might take on an event. Each button opens a dropdown; each item carries its own tooltip.

| Button | What it does |
|---|---|
| Escalate | Hand the event to an on-call supervisor (see below) |
| Send Report | Email a prefilled report to the site's contacts - General, System Offline, Suspicious Activity, or Package Delivery - plus Report Technical Issue for TetherX support |
| Call | Call a site contact, or Call Supervisor (see below) |
| Deterrence | Sound a siren, open two-way talk, or play a pre-recorded warning over the camera (availability depends on the camera) |
| Flag | Flag the footage so it is kept and not overwritten (see below) |
| Open Live | Open this camera, or the whole site, live in a new tab |
Escalating to a Supervisor
Regular operators are never stuck on a difficult event. Two actions hand it up the chain to a supervisor (a monitoring-station operator marked as the on-call escalation target):
- Escalate Send to On-Call Supervisor opens a report email prefilled with every supervisor's address and a short escalation note, so you can describe what you are seeing and pass the event over.
- Call Call Supervisor rings your monitoring-station supervisor directly for live guidance, listed first in the Call dropdown above the site's own contacts.
Tip: Use Call Supervisor when you need an immediate decision, and Escalate when a supervisor should take the event over and continue handling it.
Flagging Footage
Flagging marks an event's footage to be kept and protected from being overwritten as drives fill. The Flag button opens a dropdown where you choose how long to keep it:
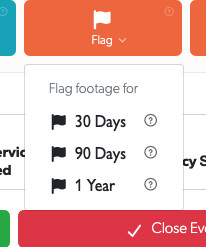
- 30 Days, 90 Days, or 1 Year
- Once flagged, the button turns amber and reads Flagged, and a badge by the Event ID shows the auto-clear date
- The flag clears itself automatically when the retention period ends - no manual cleanup
- Re-open the dropdown to change the duration or clear the flag early
Warning: Flagging needs the TetherBox online - it has to be told to keep the footage and back it up to the cloud. If the unit is offline, the flag options are unavailable until it reconnects.
Action Taken
Record the outcome of your review with the Action Taken toggles. These persist on the event for reporting and audit:
| Toggle | Use when |
|---|---|
| Observed - No Action Taken | You reviewed the event and nothing was required |
| Observed - Report Sent / Client Notified | You reviewed and notified the client |
| Emergency Services Dispatched | Police, fire, or ambulance were called out |
| Emergency Services Arrived | Emergency services reached the site |
Closing or Returning the Event
Below Action Taken:
- Return to Queue releases the event back so another operator can pick it up - it stays open. Use this for the supervisor handover: flag the footage, then return it to the queue so it shows up for whoever takes over.
- Close & Next Event closes this event and immediately opens the next oldest open one, so you can work straight through the queue.
- Close Event marks it handled.
Event Notes
At the bottom, Event Notes is a running comment thread on the event. Add what you saw and what you did - it stays attached to the event for anyone who reviews it later.
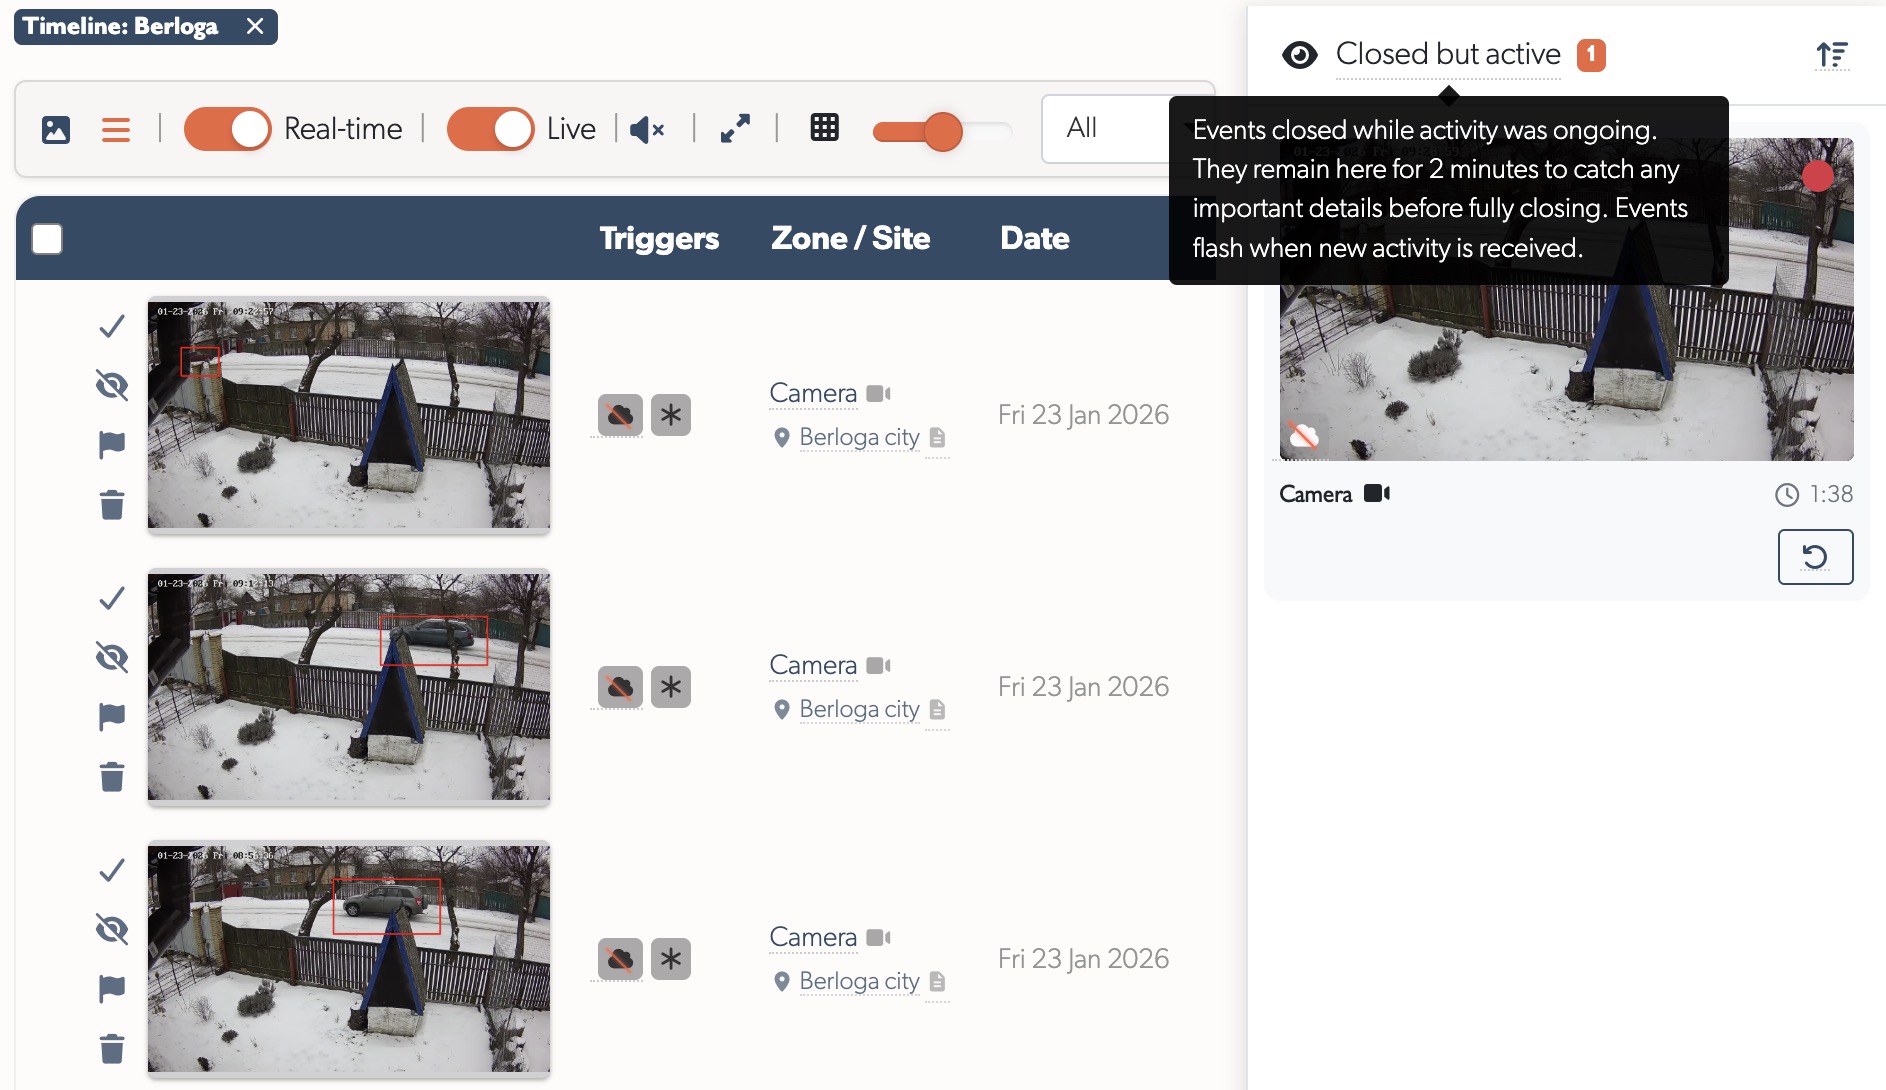
The Monitoring Strip
When you close an event that still has active analytics or motion, it moves to the Monitoring Strip on the right side of your screen instead of disappearing immediately.
How It Works
- Events remain in the monitoring strip for a configurable period (default 5 minutes) before automatically closing
- A countdown timer shows time remaining for each event
- Events are sorted oldest first by default (closest to expiring at top)
- In the final 30 seconds, the countdown pulses red - giving you a chance to double-check nothing important is happening
Activity Alerts
- Events flash whenever new analytics are detected (person, vehicle, motion)
- This draws your attention to sites with ongoing activity that may need reopening
- Click the reopen button to bring the event back for full review
Tip: The monitoring strip helps you catch important activity that occurs just after you close an event - such as a person returning or a vehicle entering after initial movement.
Live Preview Features
Live Camera Preview on Hover
In List View, hover over the camera icon next to a site name to see a live preview of what's currently happening on that camera.
This is useful for:
- Quickly checking if activity is ongoing before opening the full event
- Verifying the camera is operational
- Getting context before reviewing recordings
Live Thumbnail Toggle
Enable Live Preview in the view menu to replace static event thumbnails with live camera feeds for any event still in progress.
- Shows real-time footage instead of a captured moment
- Helps identify ongoing incidents
- Automatically reverts to static thumbnail when the event completes
Controlling Event Flow
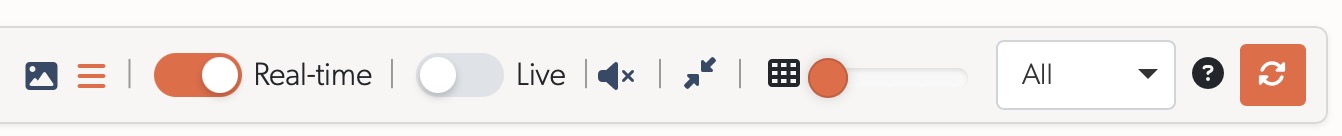
Pausing Real-time Updates
When processing a backlog of events, use the Real-time toggle in the view menu to temporarily stop new events from appearing.
This helps you:
- Focus on existing events without interruption
- Process events systematically without the list shifting
- Catch up during busy periods
Warning: Remember to re-enable real-time updates when you've cleared your queue. New events will still be recorded - they just won't appear until you toggle it back on.
Site Notes / Post Orders
Site notes (also called post orders) with attachments contain critical information for responding to events at specific locations. They typically include:
- Site address and cross streets
- Monitored hours
- Keyholder contact details
- Emergency response procedures
- Priority cameras and special instructions
- Site maps and access information
Operator accounts can read site, zone and camera notes by default. They appear in the operator console (in the left panel, described above) and in the event list.
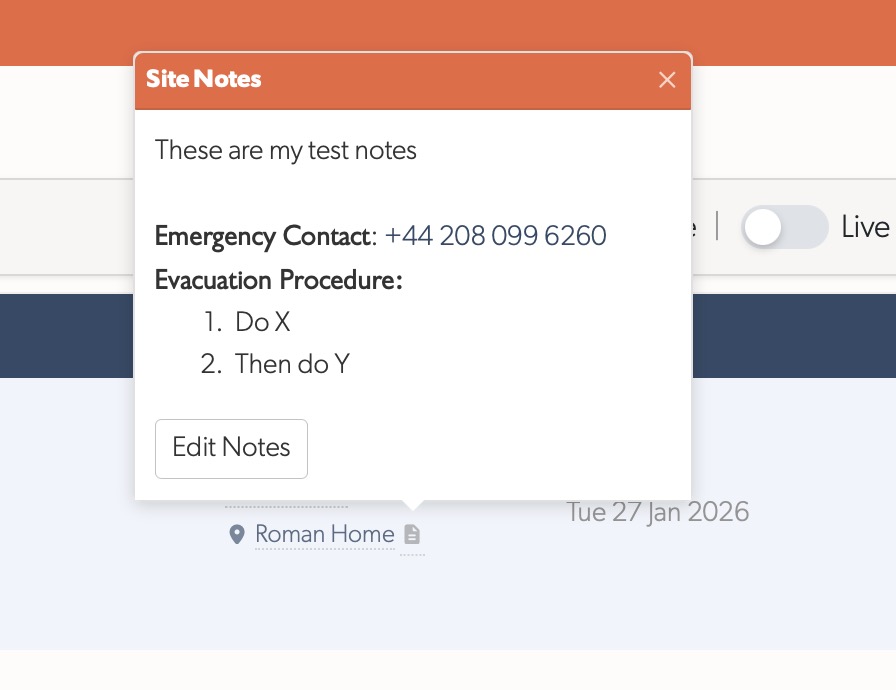
Viewing Site Notes in the List
Look for the notes icon next to the site name in the event row. Click or hover to view the notes in a popover.
Example Site Notes Format
**ABC Industrial Park**
123 Example Street, London, EC1A 1BB
*Cross Streets: Example Road / Sample Lane*

───────────────────────────────
**Monitored:** 18:00-06:00 Mon-Fri, 24H weekends
───────────────────────────────

**Emergency Contacts:**
• Site Security: 020 7123 4567
• Supervisor: 07700 900123
• Police (non-emergency): 101

**Response Procedure:**
1. Monitor and capture video/photos
2. Document in event notes
3. Email: security@example.com

**Priority Cameras:**
• Camera 3 - Main entrance ⚠️
• Camera 7 - Loading bay (active 06:00-18:00)

**Notes:**
Night guard on site after 22:00
Tip: If site notes need updating, click the Edit Notes button in the popover (if you have edit permissions) or notify your supervisor.
Zone and Camera Notes
In addition to site notes, individual zones and cameras may have their own notes with attachments:
- Zone Notes - Instructions specific to that camera view or monitored area
- Camera Notes - Technical information about the camera or special handling
Quick Reference
| Action | How |
|---|---|
| Switch to List View | Click in view menu |
| Sort oldest first | Select today's date in sidebar |
| Pause new events | Toggle off Real-time in view menu |
| View live camera | Hover over camera icon |
| View site notes | Click notes icon |
| Reopen monitored event | Click reopen button in monitoring strip |
| Enable live thumbnails | Toggle on Live Preview in view menu |
| Select multiple events | Drag a selection box across events |
| Deselect all events | Press Escape |
| Open the operator console | Click any event in the list |
| Escalate to a supervisor | Escalate Send to On-Call Supervisor |
| Call your supervisor | Call Call Supervisor |
| Keep footage | Flag choose 30 Days / 90 Days / 1 Year |
| Hand an event over | Flag the footage, then Return to Queue |
Reporting Issues
If you experience glitches, slowdowns, or unexpected behaviour while processing events, please report it so we can investigate. TetherX includes ARC Slowdown Diagnostics - internal tooling that helps our support team quickly identify and resolve performance issues in control room environments.
ARC Performance Report
For monitoring station performance issues, use the dedicated ARC Performance Report form on our support page. This form collects all the diagnostic information we need to investigate quickly.
Before submitting, have the following information ready:
| Information | Example |
|---|---|
| Time window | 14:20-14:30 (5-10 minute window when issue occurred) |
| Date and timezone | 23 Jan 2026, GMT |
| Affected sites | ABC Warehouse, XYZ Industrial Park |
| Speed test results | Visit speedtest.net - note download, upload, and ping |
| Workstation specs | Windows 11, Chrome v120, 16GB RAM |
| Screenshots | Full-screen capture showing the issue |
How to Report
The fastest way is straight from the event you were viewing:
- In the operator console, open Send Report Report Technical Issue
- The ARC Performance Report form opens already linked to that event
- Fill in the issue type, time window, and description
- Add optional diagnostic information (speed test, workstation specs)
- Attach any screenshots showing the issue
You can also open the same form from the support page when the issue is not tied to a single event.
Tip: For intermittent issues, note approximately how often they occur and any patterns you've noticed (e.g., "happens during busy periods" or "only affects certain sites").
Warning: If the issue relates to a specific site or event, include the site name and a link to the affected event in your report. This helps our team investigate the exact data you were viewing when the problem occurred.
See Also
- Control Rooms - How TetherX runs control-room, ARC and GSOC operations
- ARC Performance Reports - Daily metrics for event handling, operator performance, and camera activity
- Events View Menu - Detailed guide to all view menu options
- Events - Overview of the events system
- User Types - Operator, supervisor and other account roles
- User Permissions - Operator permissions, including bulk actions and supervisor flag
- Notifications - Event escalations and the alerts operators receive