Table of Contents
2026 Highlights
Cameras & Devices
From plugged in to recording, without manufacturer software or per-camera logins.
Camera Onboarding & Reconfiguration
Bring any camera to its best settings - whether it was installed today or years ago, on DHCP or a static IP.
Automatic Configuration. TetherBoxes apply recommended stream settings (bitrate, codec, profile, framerate, resolution) to any compatible camera, new or already commissioned, turning hours of per-camera setup into nothing. No opening each camera's IP one by one, no learning a different manufacturer's software per brand. Requires native camera APIs (Hikvision, Merit-Lilin, Homaxi and many others) or ONVIF. Visual indicators flag issues with clear explanations, and a "Disable Defaults" toggle keeps manual control where needed.
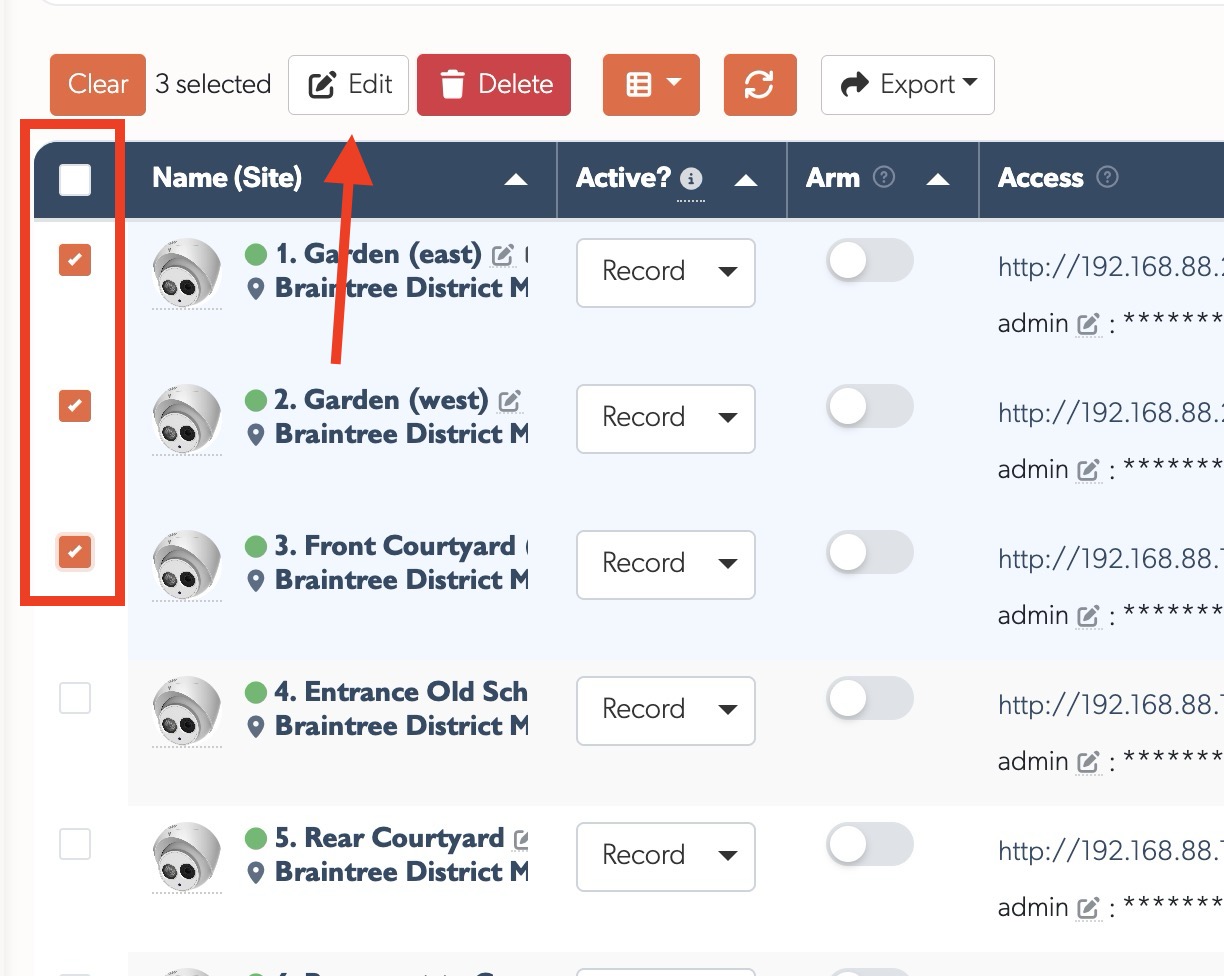
Bulk changes. Select multiple cameras with checkboxes (including select all), then apply settings - active mode, credentials, recording mode, schedule, notifications, cloud - across an entire site in one operation, or delete them together. Site-wide configuration changes that were once camera-by-camera now take a few clicks.
Activation. Brand-new, unconfigured cameras and recorders can be activated straight from the cloud. Devices flagged as requiring activation show an Activate button next to their IP on the Devices page; a single click sets a secure password and sensible defaults.
Static IP assignment. A new Network section on the camera API tab handles addressing for sites that want it. Auto-Assign moves a camera onto the next free address on the private 192.168.88.x network in one click, isolating it from the customer LAN so it is only reachable via the TetherBox; IP, netmask, gateway and DNS can also be set manually. DHCP cameras work fine without this step. See Camera API Tab.
Professional Monitoring
Built for Alarm Receiving Centres and remote monitoring stations.
Monitoring Strip for ARCs
A new workflow designed for Alarm Receiving Centres (ARCs) and remote monitoring stations. When operators close an event that still has active analytics or motion, instead of disappearing immediately, the event moves to a Monitoring Strip on the right side of the screen - alerting operators to ongoing activity and allowing them to reopen with one click. See the Monitoring Station Operator Guide for the complete workflow.
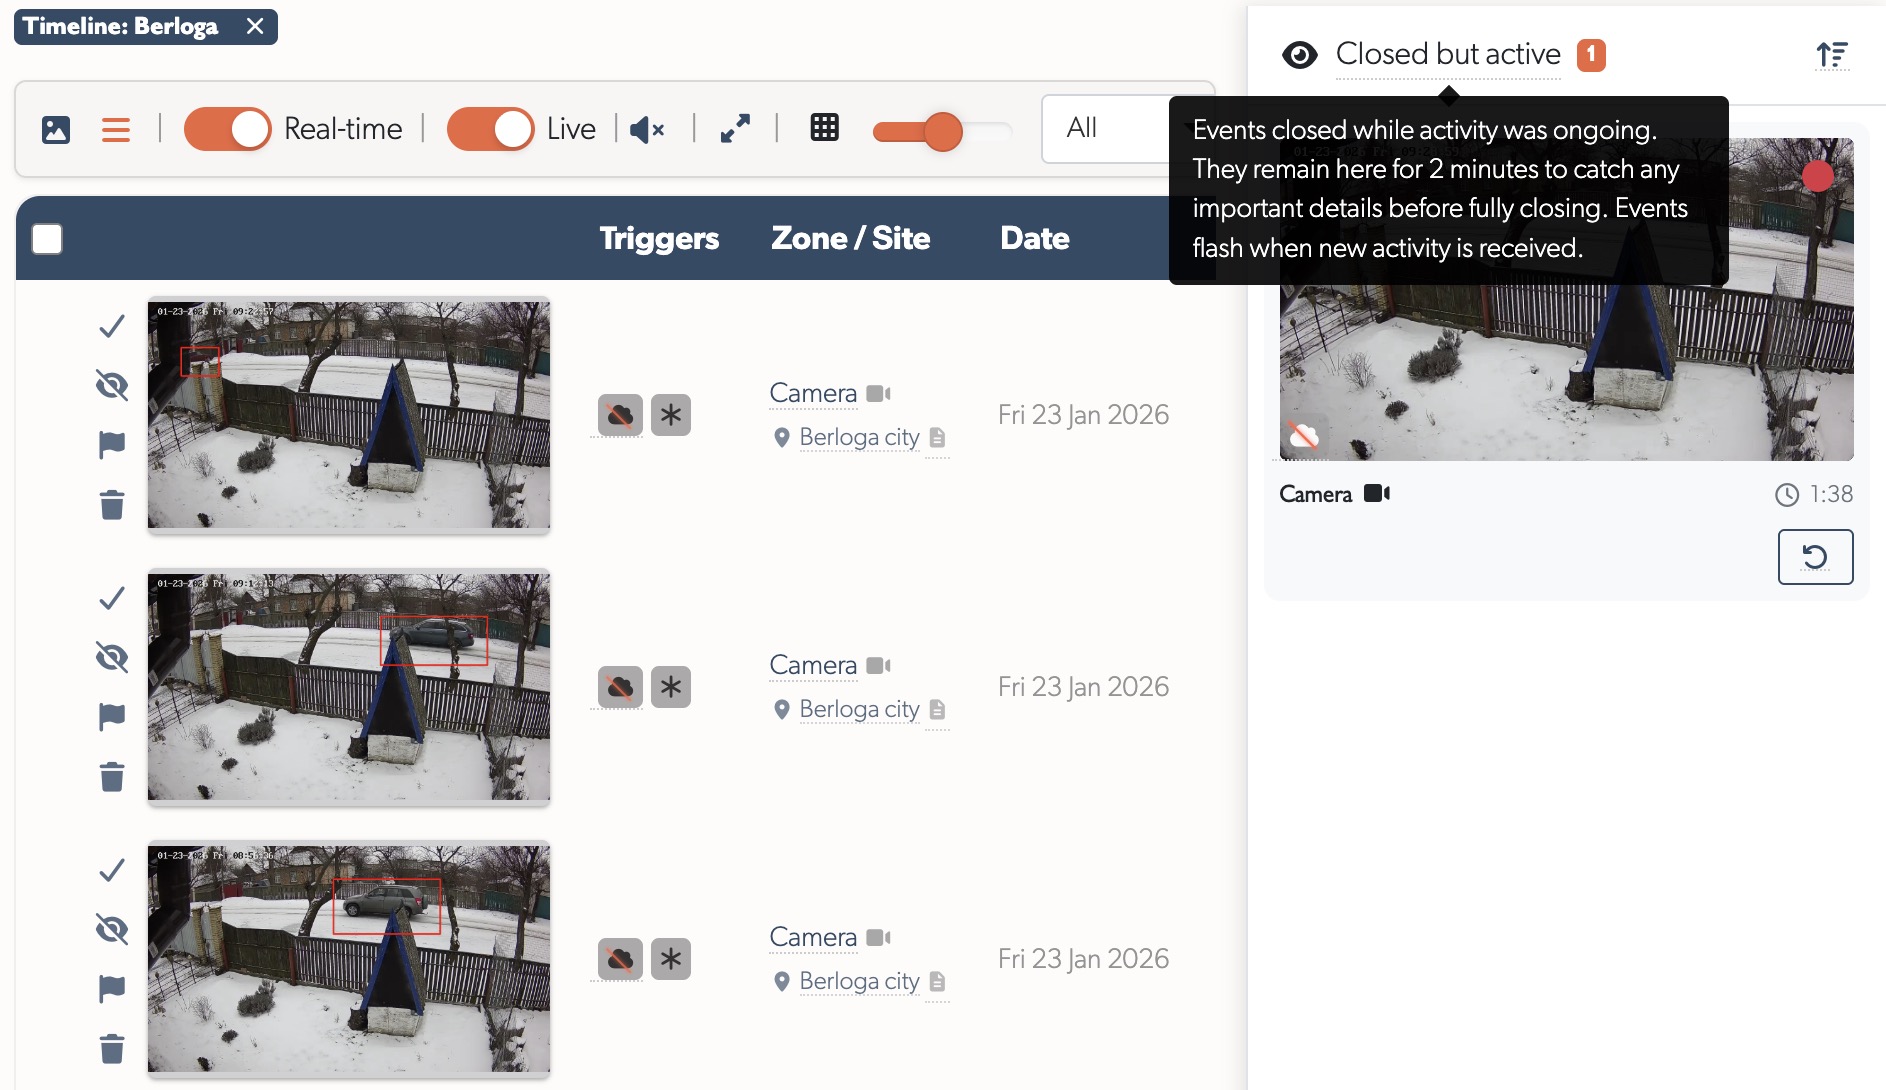
Dramatically fewer events: By keeping events open while activity continues, a single event covers what would previously have generated multiple separate events - sites that showed thousands of events now show hundreds.
Tip: If you'd like your TetherBox professionally monitored by an Alarm Receiving Centre, or want to add police response to your site, contact TetherX Support to discuss options.
Monitoring Station Operator Console
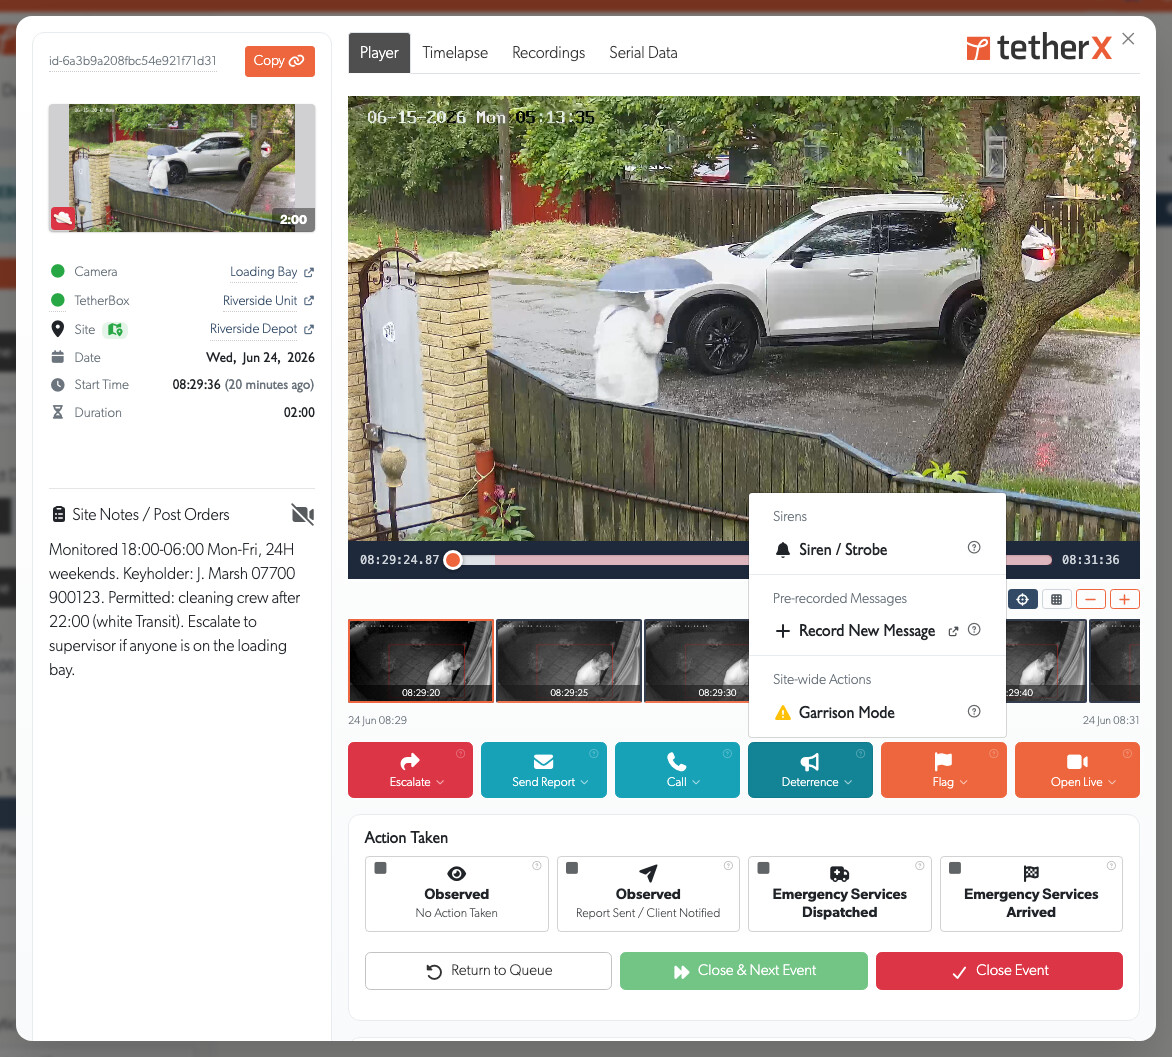
A focused, full-screen console built for monitoring-station and ARC operators. Each event opens with a toolbar to set it pending, release it back to the queue, mark that action was taken, close and jump straight to the next event, or call a supervisor. A new Operator user type sees only the events for the zones it is assigned, with the event list tuned for sit-and-watch use, and any operator can be marked a Supervisor to receive escalation calls. See the Monitoring Station Operator Guide for the full workflow.
Talk Down (Audio Challenge)
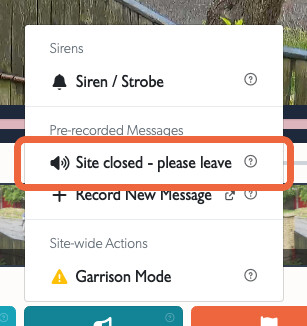
Speak to people on-site straight from a camera's live view or the operator console: hold a button to talk, play a pre-recorded warning, or hold a full two-way conversation on cameras with built-in echo cancellation. Each camera chooses where its audio plays, the TetherBox 3.5mm jack, a network (IP) speaker, or the camera's own speaker, and IP speakers are registered once from the Devices page. It works through the camera's own speaker on most major brands (Hikvision, Dahua, Axis, Hanwha, Uniview and many more) using native two-way audio or the ONVIF Profile T backchannel, and with any camera at all when routed to the TetherBox jack or an IP speaker. See Audio Challenge.
ARC Performance Reports
Pre-aggregated daily reports for Alarm Receiving Centres showing event handling, operator performance, and camera activity. Trends page displays 60-day charts for events and response times. Day details show KPIs, hourly breakdowns, operator tables, and busiest cameras with direct links.
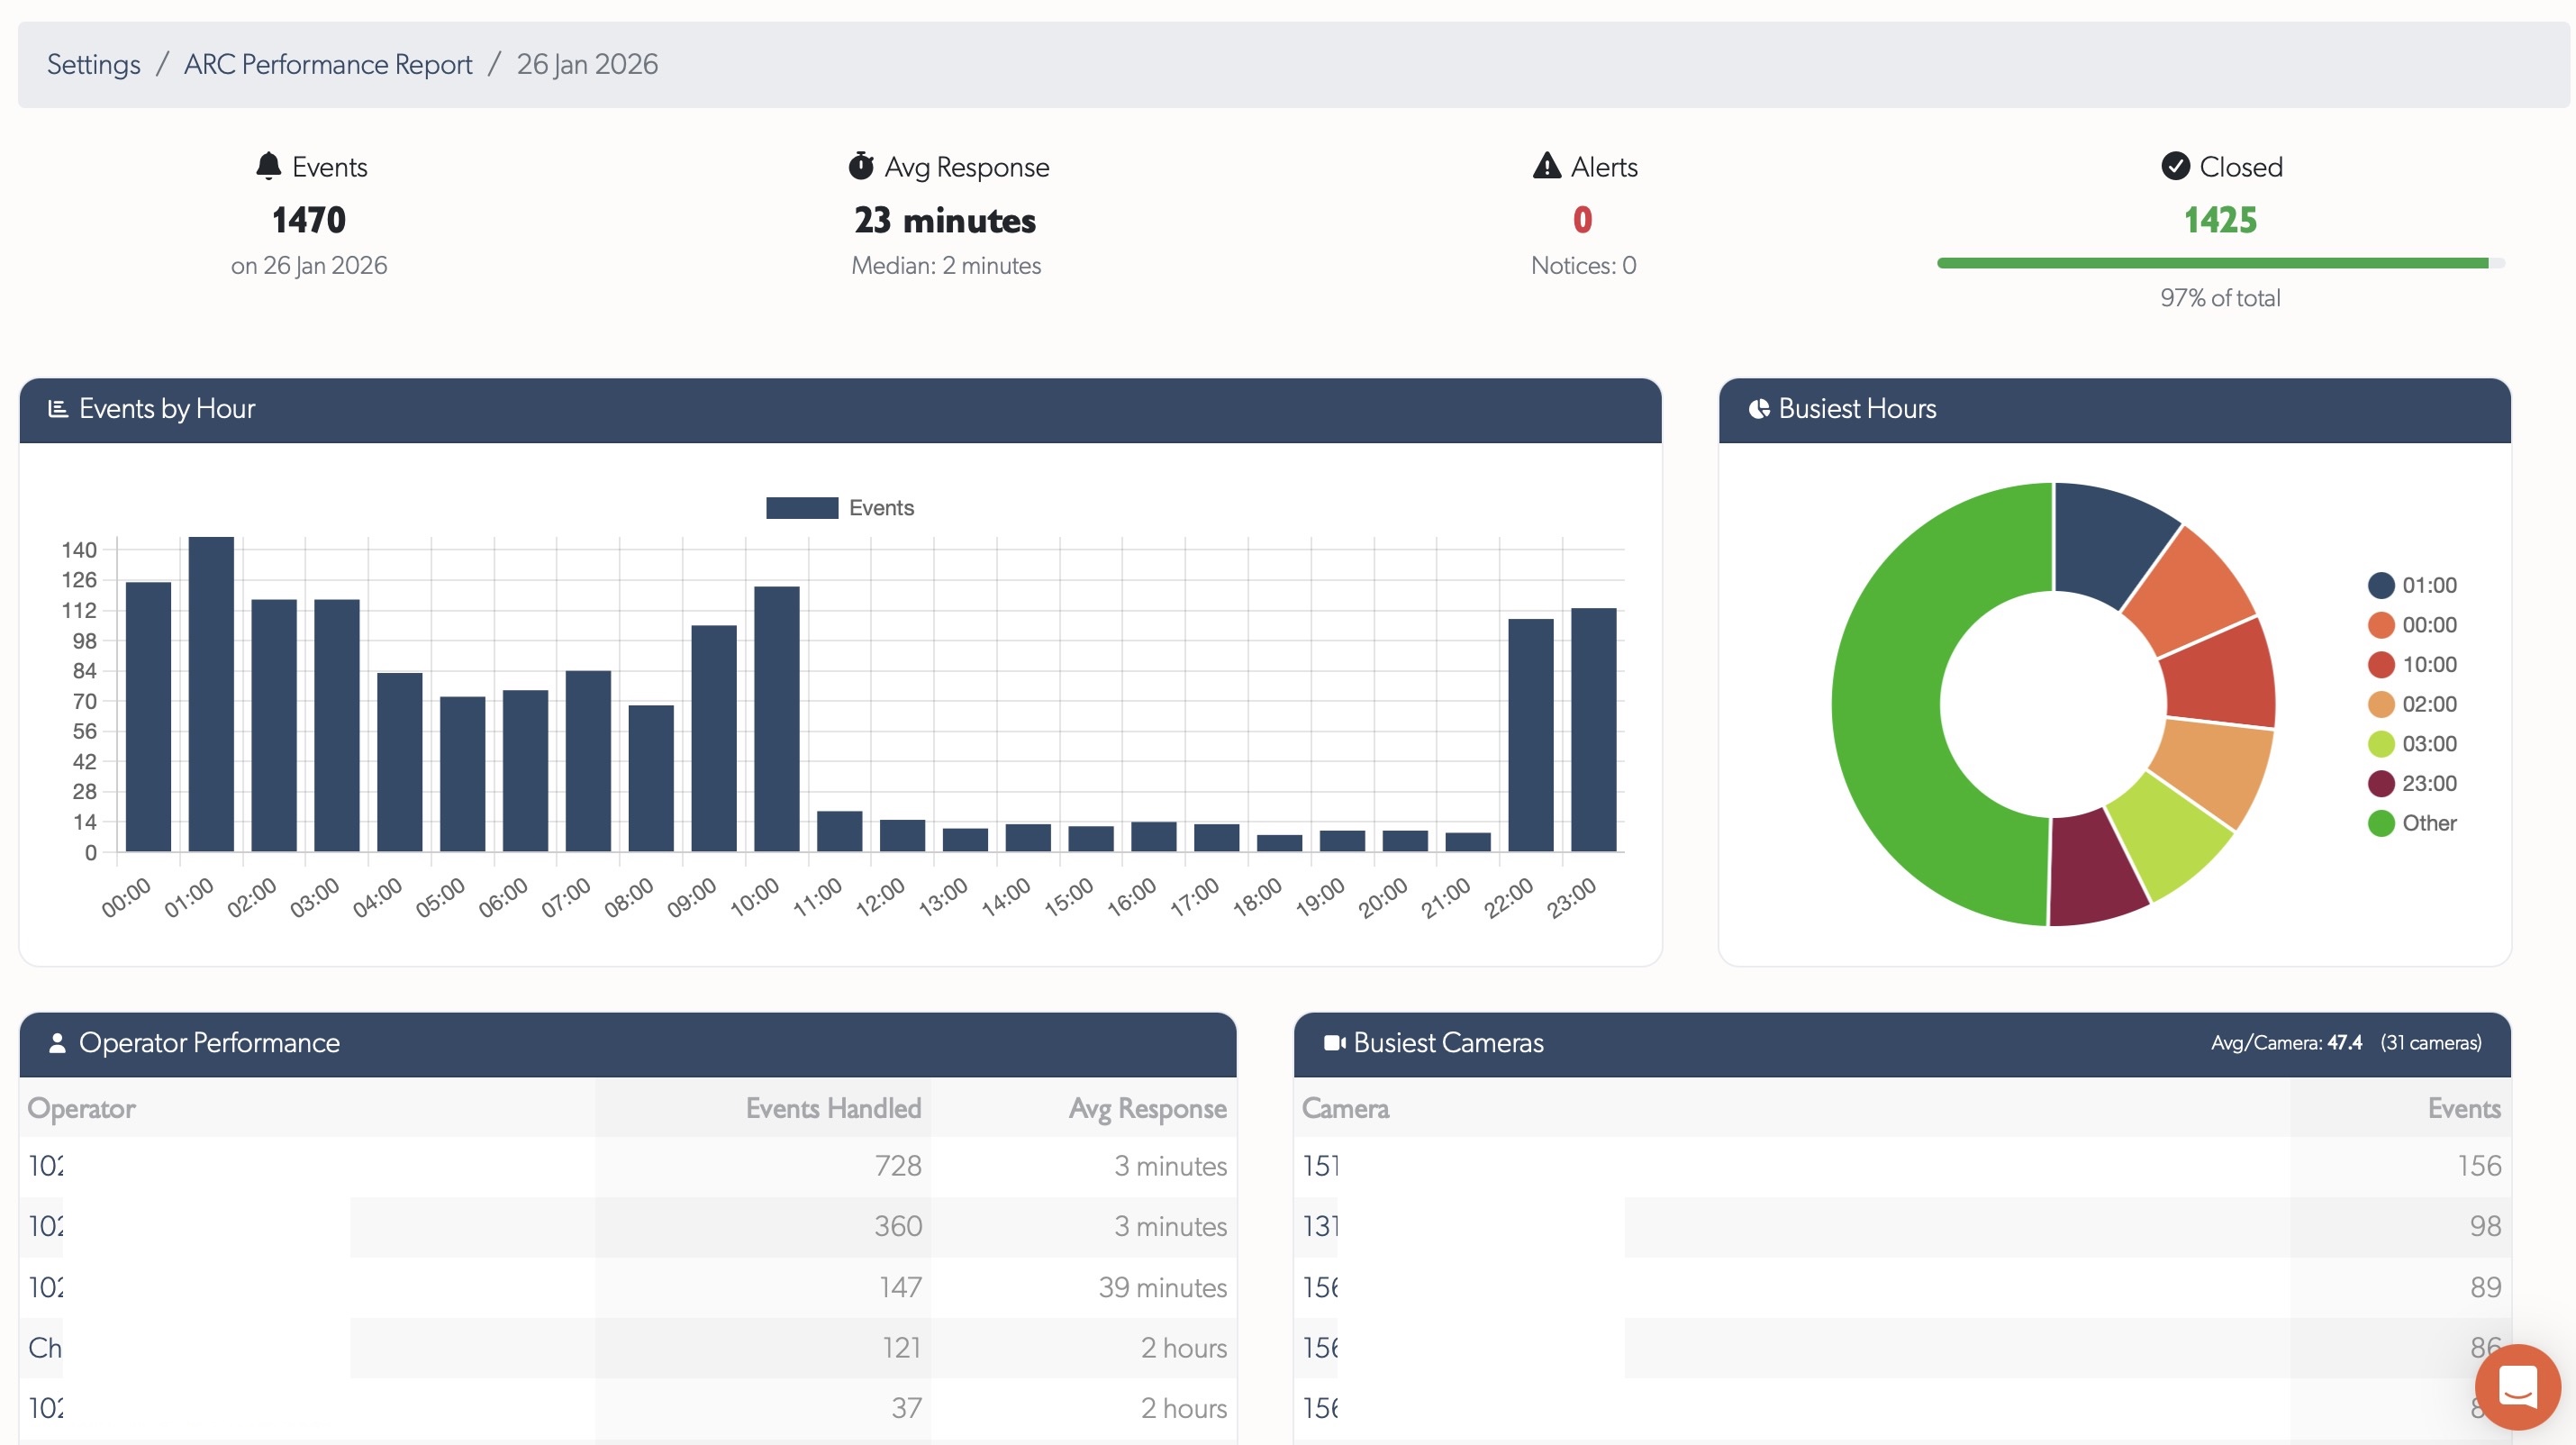
See ARC Performance Reports for full documentation.
Control Room Slowdown Diagnostics
New internal diagnostic tooling enables TetherX support to instantly investigate operator-reported slowdowns. In alarm receiving and control room environments, real-time operation is paramount - seconds matter when key holders or police need to be contacted during serious events. Issues that previously took hours or days to diagnose now take seconds.
Operators simply provide a 5-10 minute time window in their local timezone. Diagnostics then analyse rate limiting, temporary IP bans, server errors, TetherBox updates, service health, VPN connectivity, and request patterns across all system layers.
See Q1 2026 release notes for full details on all diagnostic capabilities.
Health Monitoring
Proactive care: spot problems before they become outages.
Proactive Fault Detection
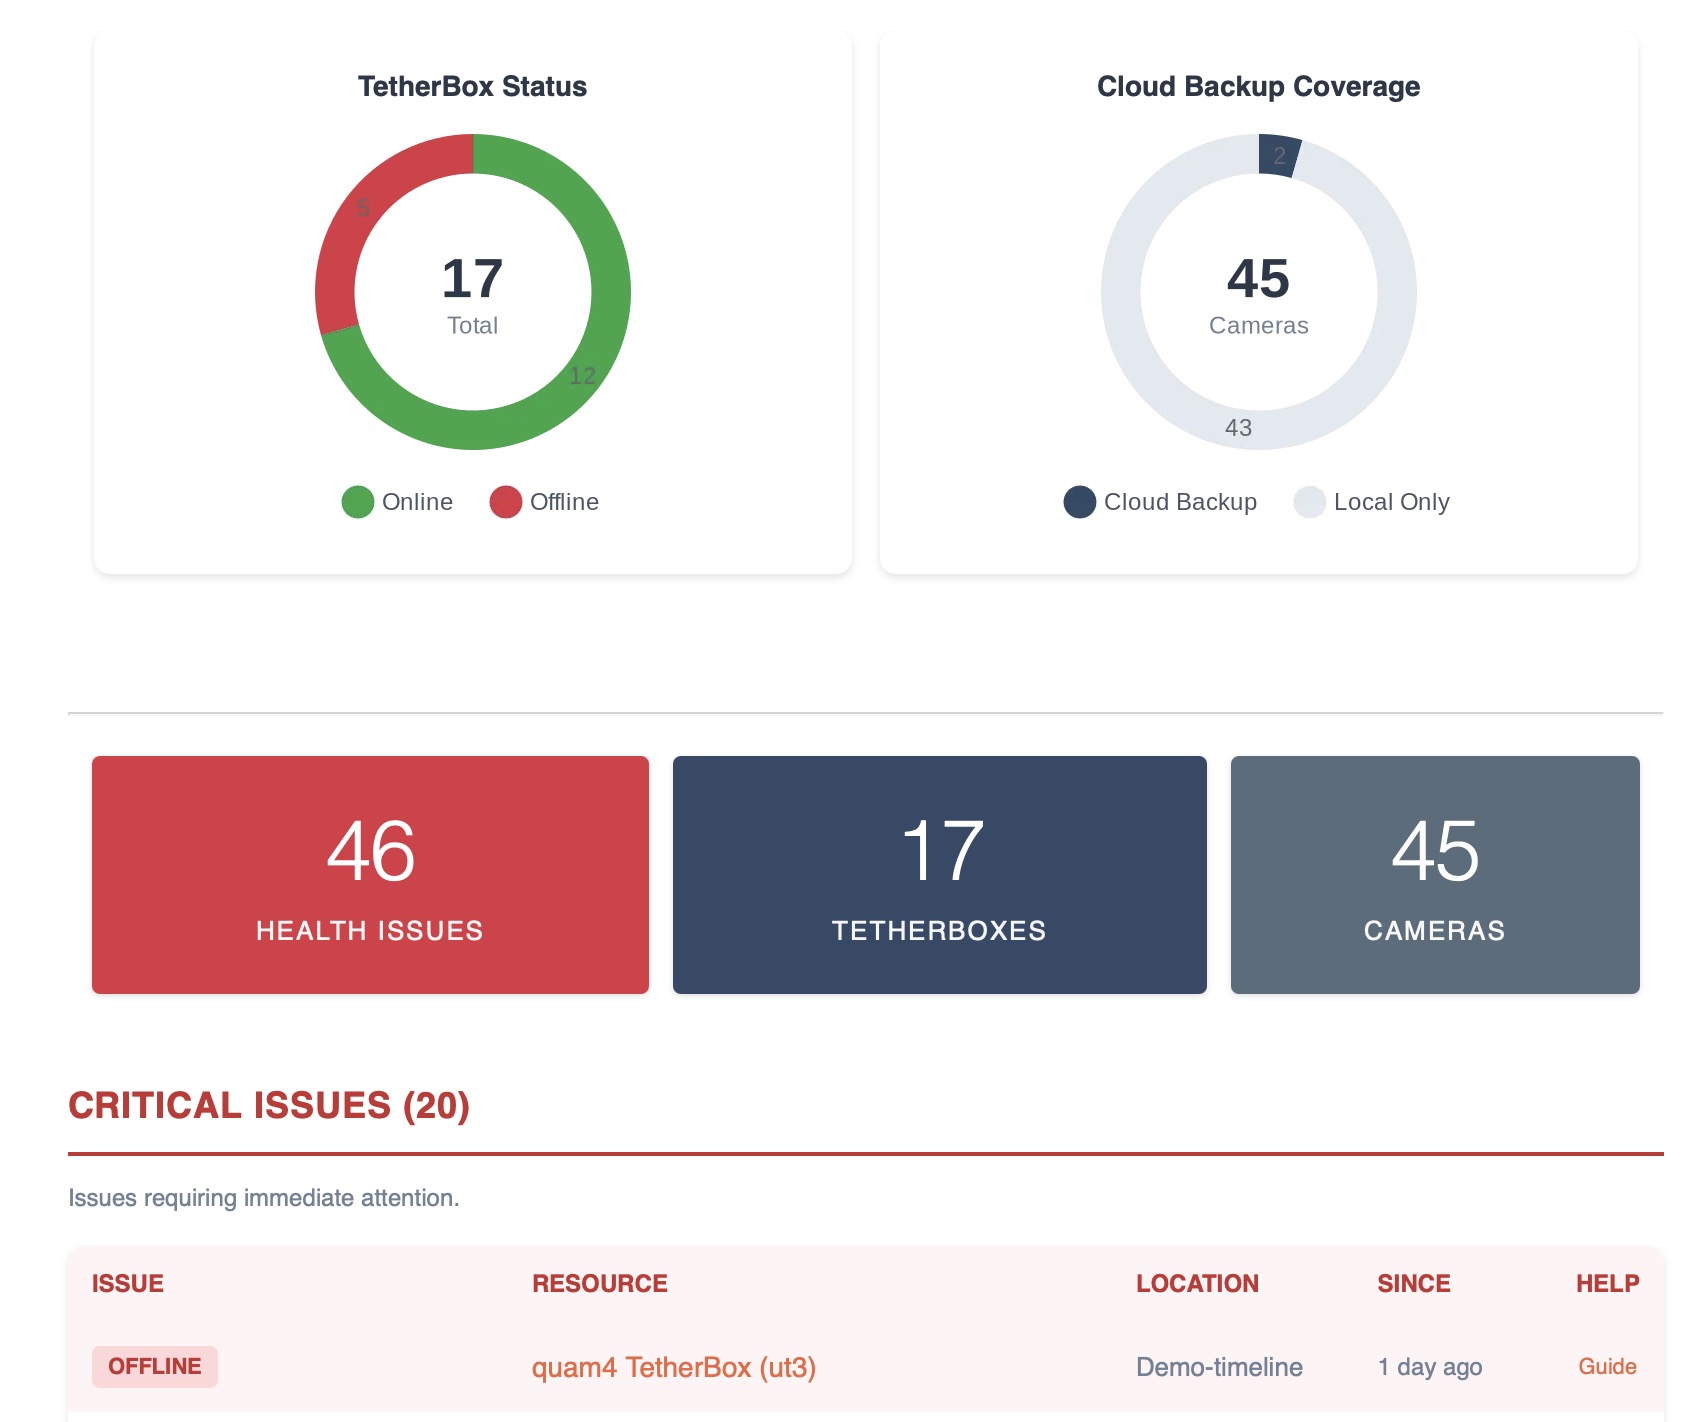
Automatically flags units with frequent reboots (>1 in last 2 days) or unstable connections (>1 reconnect in last 2 days) with clear counts and investigation links. Health Reports highlight units requiring attention - frequent reboots suggest UPS issues, frequent reconnects indicate network instability.
Tip: Review your Health Reports to identify units with frequent reboots or unstable connections before they cause service problems.
Health Report Redesign
Health Report email completely redesigned with colour-coded health tables - Critical Issues (red), Noteworthy (orange), Suggestions (blue), and Monitored Devices (purple). Each issue type links directly to the affected resource and relevant help documentation. Includes a comprehensive legend explaining all 19 issue types covering TetherBoxes, cameras, drives, and monitored network devices.
Third-Party Uptime Monitoring
Every TetherBox now has a public, passwordless probe endpoint that returns HTTP 200 when the unit is genuinely reachable and healthy, or a 5xx error when it is not. Point Uptime Kuma, Uptime Robot or any HTTP monitor at it, alert on non-200 status, done.
See Uptime Monitoring for setup examples and the full list of supported tools.
Platform & Workflow
Your platform, your way: faster everyday operations.
Redesigned Tables
Every data table in the platform has been rebuilt from the ground up. Columns can be resized by dragging edges, reordered by drag-and-drop, and shown or hidden. Your preferences are remembered per table so the layout is always how you left it. Server-loaded tables support export to CSV or Excel. Camera tables feature model images and colourful letter avatars for quick visual identification, with inline editing and row-click to open details.
File Attachments in Notes
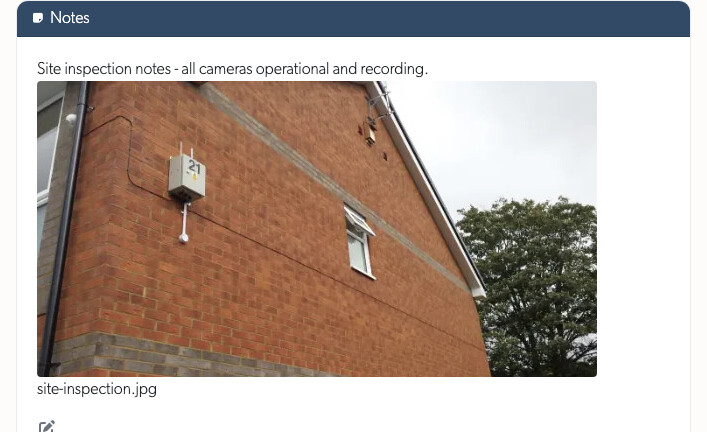
Notes editors across the platform now accept file uploads by drag and drop, paste, or the attach button, for images, documents (PDF, Word, Excel, PowerPoint, CSV) and video up to 100MB. Attachments show as thumbnails you can click to view full size, and a new management page under Settings lists every uploaded file, which resource it belongs to, and lets you filter by type or status to find and remove unused ones.
Events & Playback
See exactly what happened, and find it faster.
Richer Event Classification (in progress)
Events are being reorganised around the specific behaviour that triggered them, not just "motion". Fifteen meaningful categories keep PPE violations separate from vehicle violations separate from number-plate detections separate from environmental alarms, so filters and notifications target exactly what you care about.
Supports the richer TetherBox-AI output: specific vehicle violations (speeding, wrong way, red-light), PPE checks (helmet, hard hat, safety vest, mask), access control events (plate allowed / denied / guest), and demographic analytics where the camera provides them.
The help page listing every event type now regenerates itself whenever new detections are added, so customers always see the current capability without waiting for documentation updates.
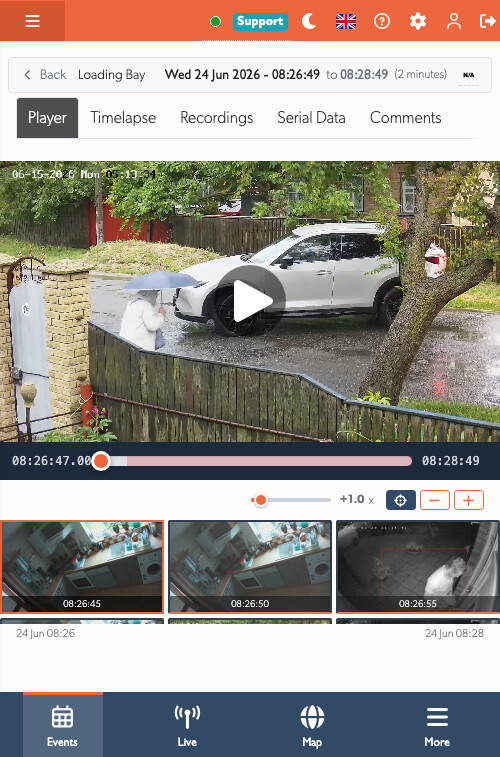
Event Player
A fully redesigned player with continuous, gapless playback across the entire event, replacing the previous one-recording-at-a-time limitation. Recording segments dropped from 60 seconds to 10 for faster downloading and scrubbing.
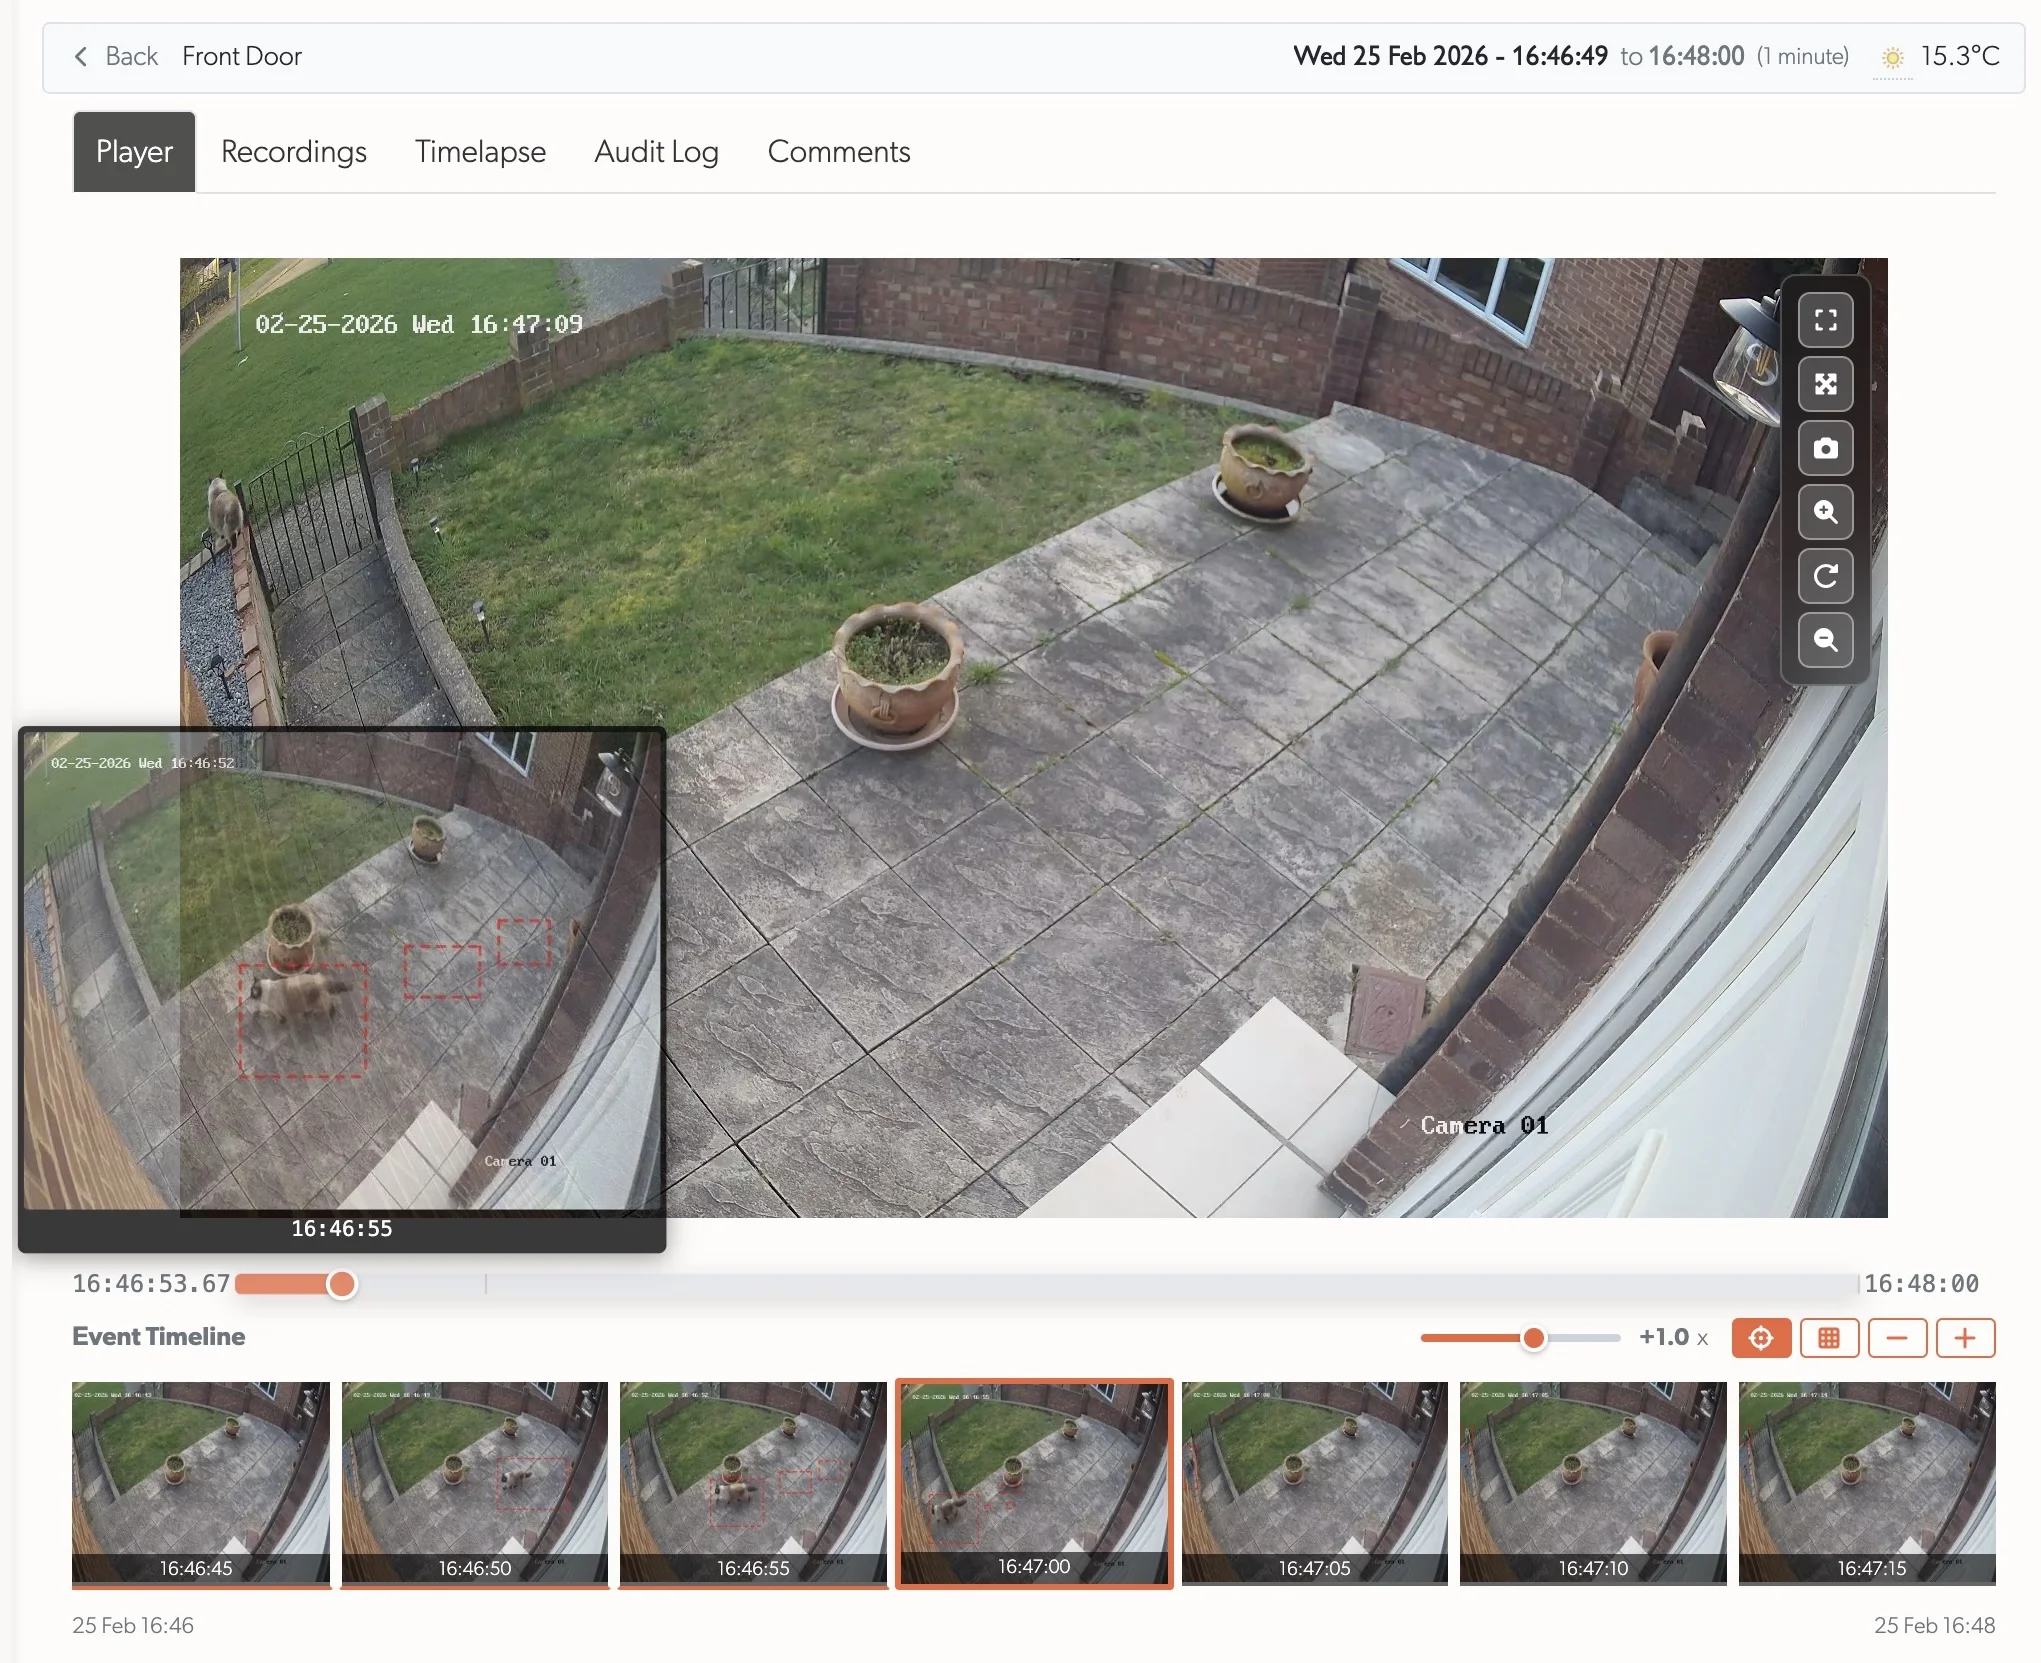
Scrub with instant thumbnail previews of the best snapshots, a timeline filmstrip showing what happened every 5 seconds, precise wall-clock timestamps, variable-speed playback, and inline or fullscreen modes. Automatic error recovery skips past corrupt video segments without interrupting playback.
See Q1 2026 release notes for full details.
Unified Event View
Events now open in a focused pop-up over the list, the same clean layout for everyone, so reviewing an incident never loses your place in the events list. The metadata sits in a tidy column beside the player, and each thumbnail carries a status pill - pending, closed or hidden - naming who actioned it, when, and how long it took from the event starting to being dealt with. An open event keeps itself live as it develops, pulling in new footage without interrupting playback and never throwing you off the tab you are on, and the open event is held in the address bar so a refresh or the browser back button brings you right back to it.
A new Control Room panel makes a monitoring station's work visible to the site: observed, report sent, or emergency services dispatched and arrived. Anyone reviewing an event can also help by closing false events themselves, the same workflow operators use in the operator console.
One Layout, Any Orientation
Recording and event pages now share a single layout that fits any screen instead of switching between separate mobile and desktop versions. Turn a phone to landscape and the video sizes itself to the space rather than running off the bottom, with the thumbnail strip and extra playback controls (speed, grid, size) tidied away so the picture and its scrub bar are all that remain. The metadata reads under the video with no sliding drawer, page content stays clear of the screen notch, the full-screen button works on iPhone, and the live camera wall re-fits as you rotate. On a slow connection the scrub bar shows a spread of preview thumbnails straight away, so you can see progress and jump close to the right spot without waiting for the whole timeline to load.
Documentation
Help and developer resources, built right into the platform.
Platform Knowledge Base
Full knowledge base built into the platform - browse Cameras, TetherBoxes, integrations, and troubleshooting without leaving your workflow. Hashtag-based search with instant filtering, contextual help links where needed, and user comments on every article (staff moderated). Submit feature requests, bug reports, device compatibility requests, and offline reports with unique reference numbers for tracking.
Tip: Press ? or click the Help menu to search documentation, browse articles by topic or tag, and submit feature requests or bug reports.
Interactive API Documentation
Replaced the static API documentation with an interactive API explorer served directly from the platform. The documentation uses your deployment's actual domain, so white-label customers see their own URLs, not hardcoded defaults. A comprehensive API Getting Started guide covers authentication setup, authorisation flow, and rate limits.
Tip: Visit API Reference to explore all endpoints interactively, or start with the API Getting Started guide for OAuth2 setup.
AI Insights
Intelligence built-in: advanced AI analysis for your installations.
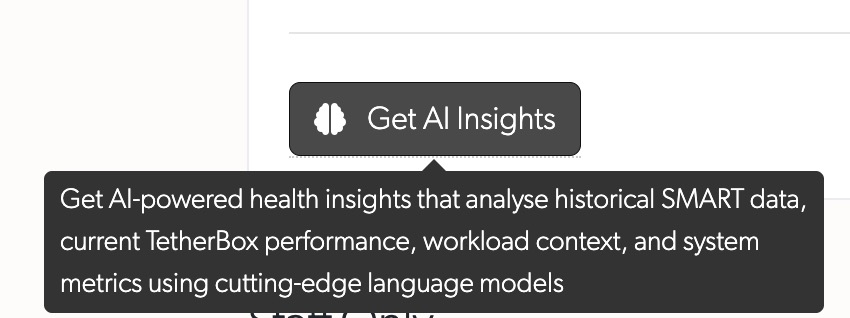
AI Drive Health Analysis
AI-powered drive health analysis compares SMART metrics from installation against current readings, combined with drive specifications, temperature trends, system workload, and reboot history. Identifies degradation trends and potential failures before they occur.
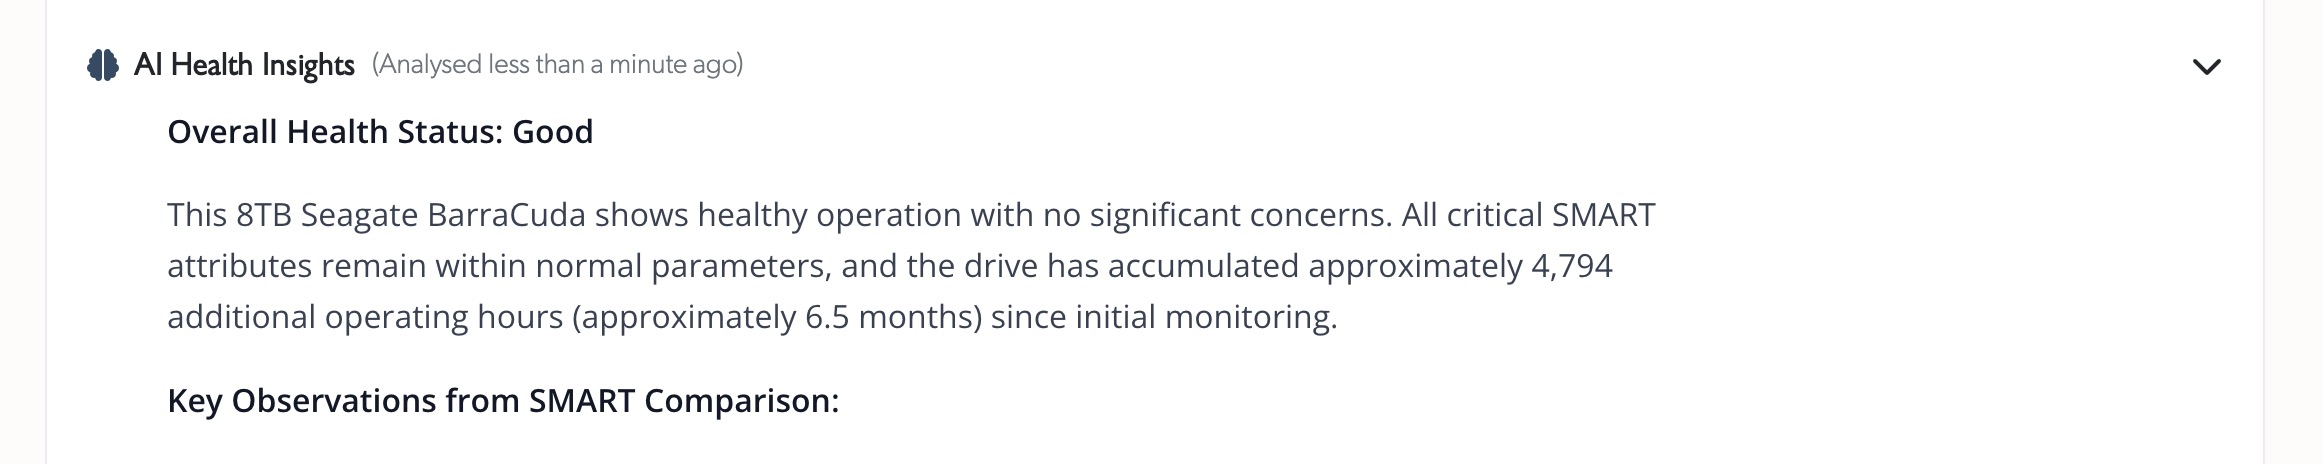
Delivers actionable reports with health status, estimated remaining life, and recommended actions.
More AI Insights coming soon for TetherBox health and performance.
Statistics
| Quarter | Commits | Lines Added | Lines Removed | Net Lines |
|---|---|---|---|---|
| Q1 | 163 | 98,075 | 46,312 | +51,763 |
| Q2 | 217 | 93,667 | 45,907 | +47,760 |
| Total | 380 | 191,742 | 92,219 | +99,523 |